Bring up the topic of electric cars and the conversation will soon drift to the issue of range. It's understandable because we've all been conditioned to think that anything below 250 miles is insufficient.
But that's gasoline talking. EVs are fundamentally different, as our Electric Car Comparison Test shows. You plug them in at home and charge them overnight while you're asleep, waking up with a full "tank" every morning instead of making a weekly detour on the way to work, where you grit your teeth as you watch the dollars rack up on the pump. Your second car is the one you take on that trip upstate, that jaunt across the desert to Las Vegas.
Still, range does matter. The more there is, the farther you can live from work and the more unplanned side trips you can take on the way. We totally get that.
The EPA does a good job of rating driving range for shopping purposes, and we generally agree with their conservative approach. Optimistic range estimates may be OK for gasoline-powered vehicles because fuel is everywhere and refueling times are short, but the same sort of best-case thinking on an electric car's window sticker could leave drivers stranded or saddled with a vehicle that doesn't meet their needs in real-world conditions.
What this means, though, is that it's easy to exceed a given electric vehicle's rated range if you follow some basic fuel saving tips: accelerate and brake gently, avoid excess speed, look well down the road so you can anticipate traffic and signals, and leave sufficient space ahead so you don't overreact to what others are doing. Many EV shoppers really want to know what is reasonably possible with this kind of prudent — but by no means hypermiling — approach to driving.
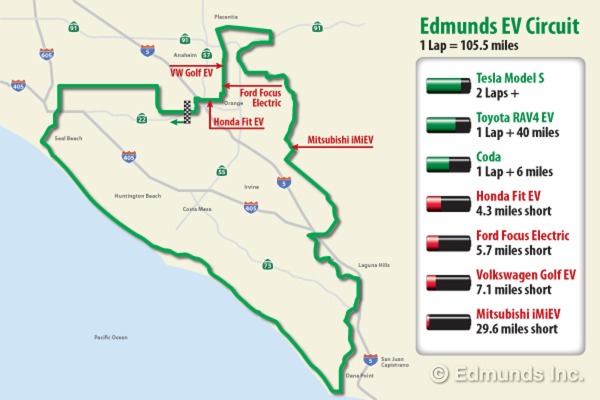
And that's where our suburban fuel consumption test loop comes in. Originally established when hybrids began to flourish, our so-called One Lap of Orange County test course is a 105.5-mile circuit around Orange County, California, that includes exactly zero freeway miles, more than a few hills and dozens of signals and stop signs along the way.
The length of the course carries no particular significance — it's not some sort of electric vehicle pass/fail test. Still, any EV that can make it all the way back to the starting point has indeed accomplished something worth noting, and we think pins stuck in a map is a good way to illustrate the relative performance of those that don't complete the lap.
In order to compare results, all of the electric cars were driven by the same driver, one per day, starting at 8 a.m. each time to experience the same weekday traffic pattern. Morning temperatures are mild on the course, so no climate control is necessary other than an open fresh air vent. From there we follow all speed limits, and we cap our speed at 50 mph in a few places where the posted limit is higher so this doesn't turn into a freeway test.
In the interest of safety we start looking for a convenient place to stop when the distance-to-empty gauge (DTE) drops to 5 miles. Any vehicles that make it back to the start are halted there. In every case the cars are trailered back to our metered Level-2 charge port so we can determine consumption. Any remaining DTE miles are added back in to determine the total range.
Lap Data
(miles)
Range
(miles)
Consumption
(kWh/100 mi)
Driven
DTE
Summary
Rated
Test
Rated
Test
2012 Tesla Model S
267.3
2
2 laps + 56 miles
265
269.3
38
NA
2012 Toyota RAV4 EV
105.5
39
1 lap + 39 miles
103
144.5
44
31.2
2012 BMW ActiveE
105.5
9
1 lap + 9 miles
94
114.5
33
27.1
2012 Coda EV Sedan
105.5
6
1 lap + 6 miles
88
111.5
46
30.6
2013 Honda Fit EV
98.2
3
4.3 miles short
82
101.2
29
19.9
2012 Ford Focus BEV
94.8
5
5.7 miles short
76
99.8
32
23.1
2012 VW Golf EV (proto)
93.4
5
7.1 miles short
TBD
98.4
TBD
28.5
2011 Nissan Leaf
81
2
22.5 miles short
73
83
34
24.7
2012 Mitsubishi i MiEV
72.9
3
29.6 miles short
62
75.9
30
20.9
We also sent each electric car to our test track, where we put them through our usual battery of tests, which includes acceleration, braking, handling and noise. The cars are also weighed in their as-tested condition. It's important to note that such numbers aren't just for enthusiasts, particularly the braking and handling results, which have some bearing on accident avoidance.
Want to read more about EVs? Check out our Electric Car Comparison Test and "What Will It Cost?"
Accel. 0-60, sec. Braking 60-0, ft. Slalom, mph Skid pad lateral g Noise @ 70 mph, db Weight, pounds 2012 Tesla Model S 4.3 108 66.0 0.86 61.2 4,770 2012 Toyota RAV4 EV 7.7 126 61.0 0.76 64.8 4,042 2012 BMW ActiveE 9.5 114 63.9 0.81 62.2 4,074 2012 Coda EV Sedan 9.7 145 61.3 0.75 66.8 3,710 2013 Honda Fit EV 9.4 140 59.7 0.75 61.8 3,228 2012 Ford Focus BEV 9.7 126 62.3 0.76 62.9 3,597 2012 VW Golf EV (proto) 10.3 132 61.7 0.78 63.0 3,534 2011 Nissan Leaf 10.2 130 58.1 0.74 63.2 3,364 2012 Mitsubishi i MiEV 14.9 120 57.1 0.65 69.7 2,586