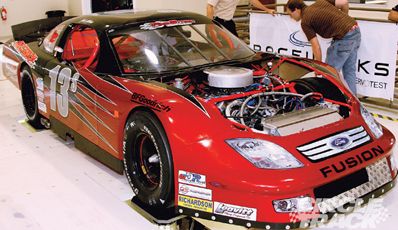
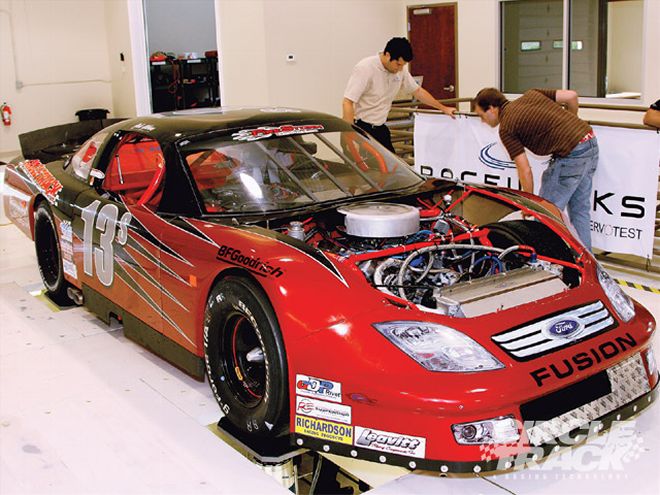
 We conduct a pre-season test of our USAR Pro Cup, Steve Leavitt race car that involves data recording, track testing, and a trip to the seven-post rig.
The seven-post rig is a process that has been talked about and thought about by many race teams. Most teams struggle to understand how this would help their program. It is, in fact, a complicated process to learn, much less to apply. We talked with the engineers at RaceWorks in Huntersville, NC, and were able to do a full range of tests on our USAR Pro Cup race car. In doing that, we learned how the process works and how it could benefit your team.
What teams must understand, and what was explained to me by the lead engineer at RaceWorks, Joe Berardi, is that the rig is a tool that can help a race team learn more about the way its race car works. It's through equipment like the rig and data acquisition that we can better understand the systems in our race car and the dynamics at work for each race track we'll run. Throughout the following discussion, Joe's explanations and comments will be shown within the quotation marks.
The seven-post rig is just that, seven hydraulic posts, three that are attached to the chassis and four that rest under the four tires. There are two motions introduced to the race car. In one set of motions, the rig simulates chassis movement and especially the tire loads that represent the forces encountered during a baseline lap. These inputs are the result of recording the three axis forces (lateral, vertical, and longitudinal forces) acting on the car as well as the movement of the shocks.
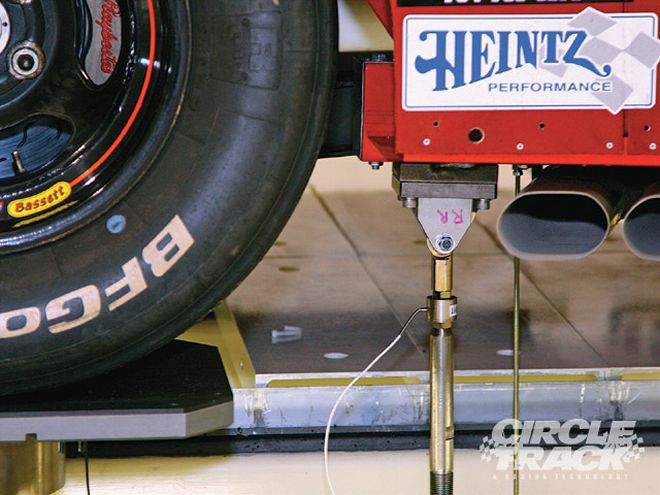 Note the chassis post in front of the tire and the pad post under the tire. These posts apply motions to the chassis and tires to simulate ontrack conditions as closely as possible.
The other motion is a more high frequency motion introduced to the tires to simulate bumps and other deviations in the actual track surface. This helps us understand how the shock and springs interact and improvements made here help maintain contact patch mating with the track surface for more consistent grip.
Objective
The objective of this work was to evaluate the performance of our CT USARacing project car at the Concord Speedway and use modern tools, including data acquisition systems and the vehicle dynamic rig to improve upon its performance. For this effort, we conducted a track test before and after a seven-post rig test session to compare and evaluate vehicle handling and performance gains.
The first stage consisted of instrumenting the car with a Pi Research data acquisition system before conducting the initial track test at Concord Speedway. The main purpose for the session was to acquire the needed information from the data and the driver about track characteristics and vehicle performance. Several setup changes were then performed in order to improve the vehicle lap times and driver comfort and to develop a baseline suspension setup that was both neutral in handling and balanced dynamically.
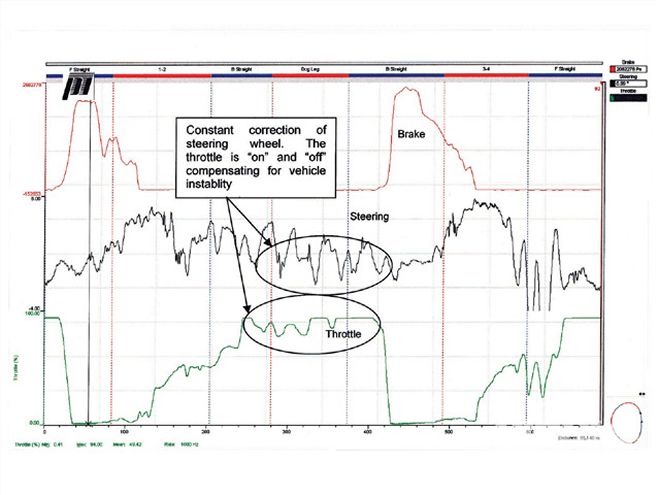 Figure 1. Driver inputs from track data at Concord Speedway. In the initial runs during the first test, the driver had considerable trouble controlling the car as evidenced by the radical motions of the steering wheel. We were able to settle the car down and significantly reduce the efforts of the driver.
We actually needed to make some last minute rearend alignment changes that were interfering with the handling. Once we sorted all of that out, we could then properly evaluate the setup and make appropriate setup changes and shock adjustments. What we ended up with was a car that produced very even tire temperatures and that had good bite off the corners.
What we didn't have for this test was a carburetor that was adjusted correctly. This hurt our exit performance when trying to accelerate. We concluded that once we came back we would see a couple of tenths better lap times with a motor that would quickly accelerate.
We also were there alone most of the time and the track had been washed clean from a heavy rain days before. The last laps of the test were done on 70-plus-lap tires and a "green" track. All of that must be taken into account later on when we come back for our post seven-post evaluation which will be the practice day for the race. Newer tires, a better track surface, and an improved motor should give us 3-4 tenths better lap times.
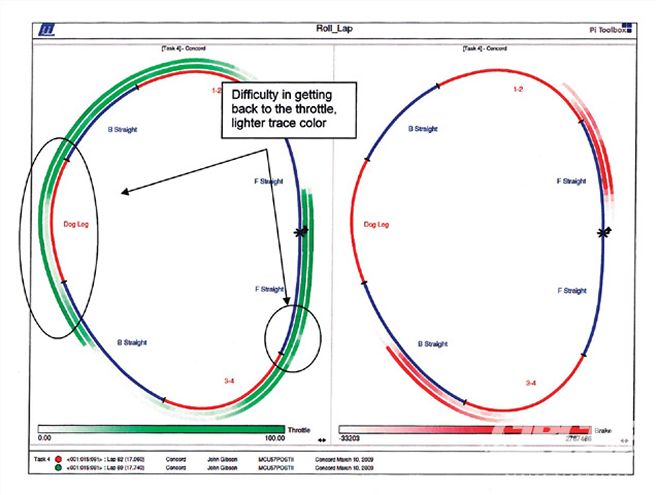 Figure 2. Driver inputs from track data at Concord Speedway-Map View. These maps show how making changes to the setup and shock settings improved the acceleration and handling.
The vehicle was then placed on the seven-post rig where changes in springs, bars, wedge, and shocks were evaluated and analyzed as to their effectiveness. At the conclusion of the time spent on the seven-post rig the race car setup was changed to try to improve and increase grip, reduce body motions, and enhance balance and driveability. Based on the fact that we had done a dynamic evaluation prior to our test and refined it at the track, it would be interesting to see how this came out.
The race car was then taken back to the track for the Friday practice prior to the Saturday race. Its performance was again evaluated and then compared to the baseline achieved on the first track test. What we saw was what we expected. Friday's test was somewhat tainted due to hot track conditions that made the track slick.
Track Test
Joe tells us, "A track test was conducted at Concord Speedway on March 30, 2009. During this test, a Pi Research data acquisition system was utilized to obtain data from the vehicle which would give an accurate representation of both the motions of the sprung mass due to lateral acceleration, track banking, and so on; and the vertical accelerations of the unsprung mass to represent the surface of the track. Concord Speedway is a half-mile oval track located in Concord, NC. Its bumpy and 'dog leg'-shaped back stretch make it unique among other tracks on the USAR schedule.
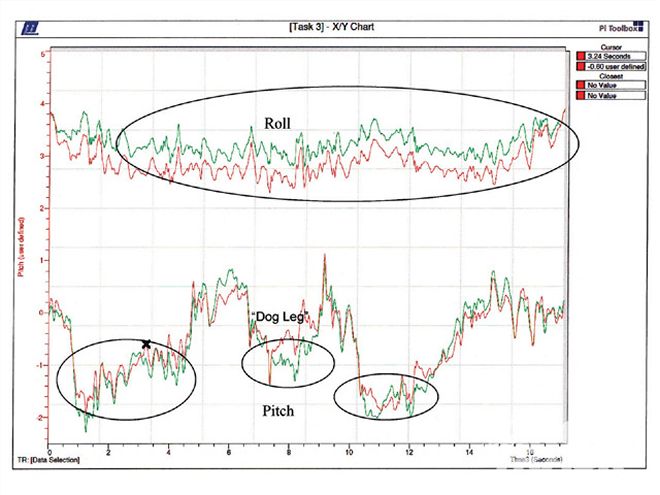 Figure 3. Body motions of the race vehicle from the initial run on the seven-post to the final run. The changes made after the initial seven-post runs were designed to reduce body roll and heave. The chart shows the team's success in controlling those tendencies.
"During the test, it was evident on the data, the car had a tendency to be tight mid-corner and snap loose on corner exit. The most challenging section of the track was through the 'dog leg' segment starting just at the exit of Turn 2 and carrying into the entry of Turn 3. It's evident from track data that the driver had to constantly correct the steering wheel and frequently be 'on' and 'off' the throttle through that section. Figure 1 shows the track data obtained from the steering, throttle, and brake versus the position on the track.
"Figure 2 is an alternative view of throttle and brake application. The darker the line color the more the throttle and brake are being applied. The throttle trace is on the left-hand map in green, while the brake is on the right-hand map in red. The two different lines around the maps represent two different laps, the outermost lap is a 17.06 while the innermost is a 17.74. It can be clearly appreciated where the driver had difficulty getting back to the throttle off of Turn 4 during the slower lap by the lighter throttle trace. On the braking trace, it's noticeable that the brakes are applied at a consistent point on the track but that for the slower lap the driver didn't need to brake as hard getting into Turn 3."
Post TestDrive File Generation Joe continues to tell us, "By placing sensors on the vehicle in key locations, data can be collected which record the exact body and wheel motions of the vehicle. These motions are then converted into a drive file which can be used as an input to the seven-post rig. This file will replicate all of the vehicle motions experienced at the track. Acceleration, braking, aerodynamics, and banking loads are all accounted for in the drive file."
"Placing the car on the rig with the exact same setup it had at the track is important for the accuracy of the drive file. This methodology allows replaying lap after lap consistently in the controlled environment of the rig where external factors, such as weather, driver error, or engine problems, don't interfere. Once the drive file is created, changes can be made to the vehicle setup and the new response can be measured. This powerful tool allows teams to "dial in" a setup for a particular track without the expense of continuous track testing.
"In order to make the car more consistent lap after lap, the focus of the test was to create a more stable platform out of the vehicle under transient conditions. Using the drive file created to replicate the track, overall grip and body motions were measured throughout the whole lap as well as an isolated area through the dog leg. This allows focusing attention on the most difficult part of the track compared with the complete lap and evaluating the different effects of the changes made on the dog leg versus the whole track.
"Body roll and pitch were considerable issues when the vehicle first came off the track and onto the rig. Through a number of setup changes on the rig, the body motions were reduced significantly by the end of the test. Figure 3 presents the body roll and pitch from the first run to the last run on the seven-post rig."
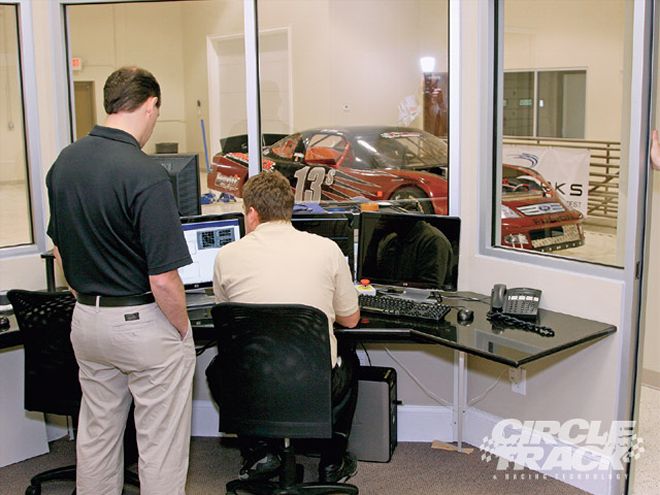 Rene Tortato, a RaceWorks engineer, reviews data with technician David Rising inside the control room that overlooks the rig. They will determine proper changes to be made after an evaluation run on the seven-post rig.
Editors Note:
It may be debated as to the effectiveness of the goal to reduce body roll in the pursuit of performance on a short track. Some argue that the improvement in aero efficiency necessitates this goal. Others argue that the methods needed to achieve this goal, i.e. very stiff antiroll bars, stiff rear springs, and so on, cause the setup to be very hard to maintain and in many cases not very consistent. We will leave that decision to the individual team.
"The first run is in red while the last run is in green. The overall roll is significantly less as seen in the graph (Figure 5) while the nose stays down better through both corners in the pitch graph. This optimization also includes the evaluation of tire grip by evaluating the variation of the contact patch load. The more this signal varies, the lesser grip the vehicle will experience on track.
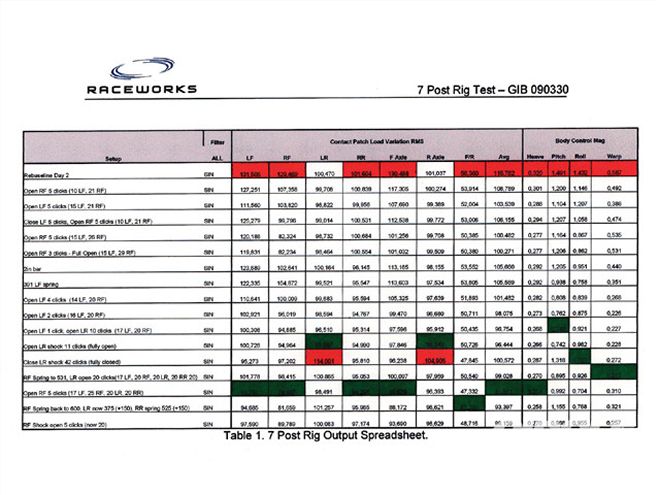
"In order to evaluate the compromise between grip and body control, RaceWorks Inc. presents the information with a graphical approach as well as in a spreadsheet that highlights the optimum setup. As it can be appreciated in Table 1, the best grip and body control numbers can be easily spotted. The green cells represent the lower values and hence, the best configuration, while the red cells represent the worst result. These results are evaluated alongside the graphical results so that all parameters are considered before assuming the best setup. Compromises are often unavoidable."
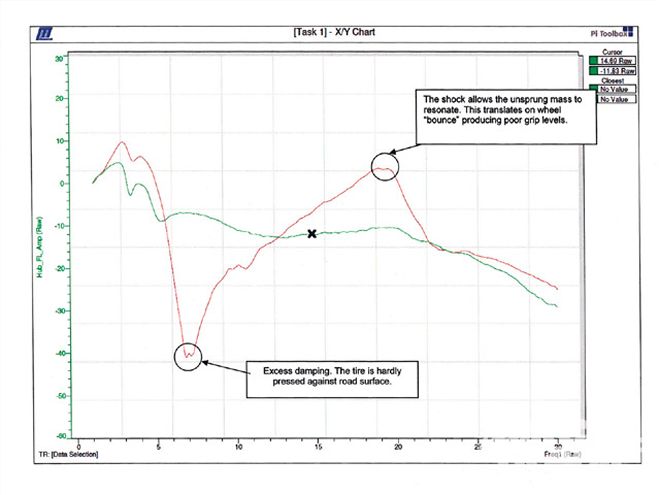 Figure 4. LF hub transfer function from the first run on the seven-post to the last. The red line represents a high degree of rebound which reduces contact patch loading and reduces grip. The adjustment of the shock provided a more even contour and improved grip level.
Frequency Sine Sweep Results
"Frequency sine sweep tests allow the analysis and characterization of the suspension system of a vehicle. This is a standard test on seven-post rig facilities and consists of exciting the vehicle with a sinusoidal motion with all wheel actuators moving in phase. This input signal starts at a low frequency (i.e., 0.5 Hz) and ends at a higher frequency value (i.e., 25 Hz) while maintaining the maximum stroke velocity constant.
"By analyzing the vehicle's reaction to the sine sweep, it's possible to find out where each corner of the car was stable and where it became unstable. The way this is accomplished is by analyzing the input versus the output of each corner of the vehicle. A graphical representation of this comparison for the left front wheel output vs. the left front input can be seen in Figure 4."
"The red trace in the graph is the setup straight from the track test while the green line shows the final setup at the end of the seven-post test. The large variation in the red line shows that the grip is inconsistent throughout the frequency range, thus the vehicle will be inconsistent to drive. The green line was from the last run of the seven-post test where it was possible to create a much more consistent response.
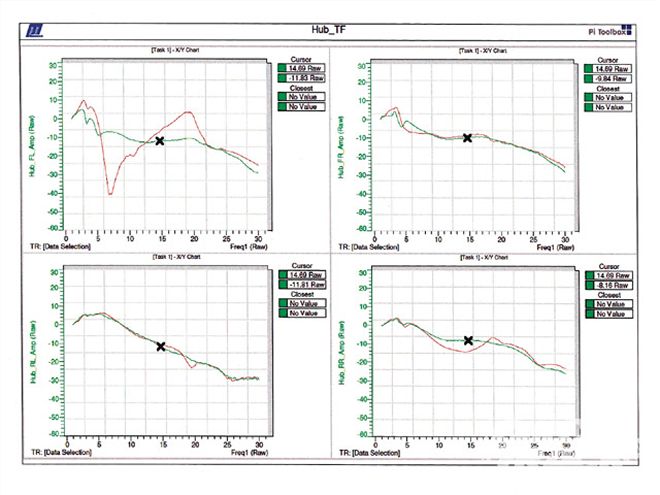 Figure 5. All four corner transfer functions from the first run on the seven-post to the last run. The red lines represent the first runs and the green lines represent the final run after changes were made. Less deviation means more grip as we can see.
"It's critical to optimize the shock and spring together as a package. The shocks on the car were adjustable. Great gains were made by adjusting the rebound settings but a complete rebuild would have been necessary to achieve optimal grip and body control. Luckily, a good selection of springs was available to find the best match for each shock on the car. The graph in Figure 5 shows how the new combination (green) gave much more consistent behavior throughout the operating range at all four corners of the vehicle.
Roll Stiffness
"A roll stiffness test was performed to calculate the roll stiffness on the front and rear axles. Units are in ft-lbs per degree of roll. It's important to note that the final roll stiffness distribution was very close to the baseline but with an overall stiffer setup. This indicates a similar weight transfer but with an overall more stable platform. Had more springs been available, a closer match would have been possible.
Race Performance
"Performance during the race weekend reflected the significant improvements achieved on the rig. The car attitude was noticeably improved as was the stability and consistency. The driver was able to run consistent, quick lap times and changes made to the vehicle during practice were effective."
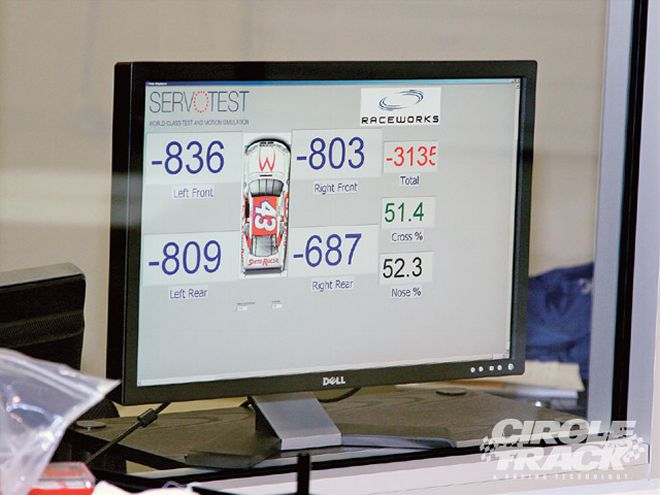 The individual wheel loads are displayed outside the control room so observers can take note.
Conclusion
What we weren't able to do was compare the first test setup against the seven-post rig setup on the same day under the same conditions. Differences that influenced the second test, which was a practice day for the race the next day and was run with the improved carburetor setting, were newer rubber than the fastest runs at the first test, and a track that was hotter and slicker in the second test. All of these caused the comparison not to be apples to apples.
The ideal scenario would've been for us to conduct the second test with both setups to properly evaluate the differences. Then, we may have taken positives from both, applied them to the car, and then run a third setup against the other two hopefully showing improvements. Comparing the performance between the two sessions related to lap times, we see little difference.
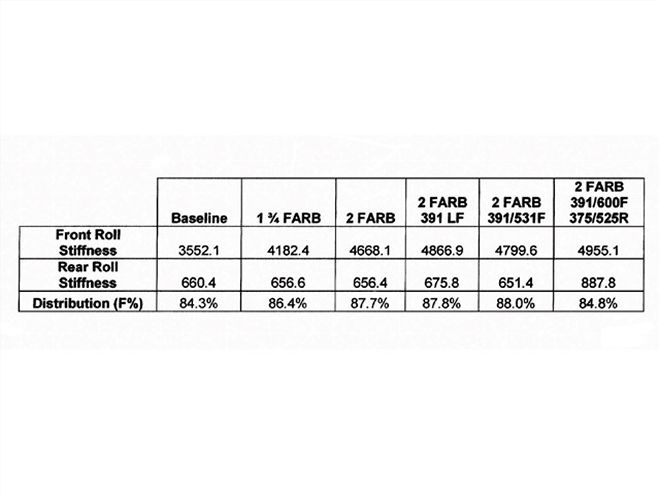 Table 2. Front and rear roll stiffness and stiffness distribution for all spring/bar changes made on the seven-post. We had conducted a design and refinement of the dynamic balance of the car before and during the initial test. Joe tried to maintain that balance when making changes to the stiffness of the setup.
The three quickest laps run in the pre-seven-post rig test were 17.07, 17.09, and 17.11. Almost all of the remaining faster laps were in the 17.1s. When the team went back to the track on fresher tires, the fastest three lap times were 17.12, 17.13, and 17.16 with most of the other significant laps in the 17.2s, 17.3s, and 17.4s. The team did a mock qualifying run on stickers at the end of practice with the first lap showing 17.07 and the second lap at 16.84. This run was made later in the afternoon and we assume the track had cooled.
Subsequent runs on those same tires yielded three fastest laps of 17.11, 17.15, and 17.16 and a comment from the driver that the car was "tight/loose center." I believe in an overall analysis that the high mid-afternoon track temperatures caused the car to be loose and the team then made changes to compensate to tighten the car. Those changes tended to make the car too tight when the track cooled in the late afternoon.
The tests, the review of the recorded data, and the time spent on the seven-post rig were very beneficial in teaching us how the various components on the race car worked together. That information combined with careful evaluation at the racetrack are all tools that can provide insight into how to improve your overall package. Remember that we are after not only fast lap times, but overall consistency and speed over long periods. Those are what truly win races.