Diagrams provided by the author and Audie Tecnology
AUTHOR'S NOTE: This is Part I of a two part series. The following text is an overview of camshaft design studying the path of the lifter as it travels the lobe of the cam. Although cam profiles effect engine performance, that result is a derivative of cylinder pressure encompassing aspects of filling, emptying, and the combustion process. Part II will be empirical, exploring how to pick out a camshaft for your Pontiac engine.
Even the most seasoned Pontiac engine builders usually feel uncomfortable when a conversation drifts to the intricacies of camshaft design. Surprisingly, the commonly used terms of duration, lobe separation angle, and overlap may not be fully understood but are used successfully by relying on empirical data. Earlier in my career, I was happy to finally master the degree wheel, but that left me yearning for more detailed camshaft information. I was confident that there had to be more to camshaft design than what the cam card told me. This frustration was compounded by the lack of information supplied or questions asked by cam grinders when ordering a supposed "custom bumpstick." Part of the problem with understanding cams is inherent to one's inability to easily view the motion of the valve lifter as it travels the lobe.
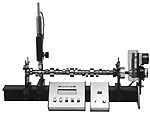
Degree wheels are essential tools in determining the placement of the cam in relation to the crankshaft's arc of rotation, but data beyond that is either nonexistent or cumbersome to derive. My search for meaningful cam data ended in the small Northeastern town of Trooper, Pennsylvania, and the office of Audie Technology. Here lies the home of the industry's easiest and most accurate cam inspection equipment, the Cam Pro Plus.
What is Camshaft Inspection Equipment?
Simply put, Cam Pro Plus is a software and sensor package for the study of lifter and valve motion. With the cam mounted on a test fixture and spun either manually or by an optional electric motor, each lobe can be measured and graphically reproduced for analysis. A highly accurate rotary sensor produces 3,600 counts per revolution, allowing measurements to .1 of a degree. It is also equipped with a linear sensor that has a resolution of 1 micron (0.00004) to measure the movement of the valve or follower. Not limited to external use, Cam Pro Plus enables you to fixture it to read a cam while in the engine. Interfaced through an IBM-compatible PC, it allows the operator to view all characteristics of the cam grind.
Originally developed for quantitative analysis of cams in the pursuit of engine performance, many advanced Pontiac engine builders are using this system to quality control the cams they purchase. It is disappointing that every cam is not manufactured with the same quality, and it is common to discover variations in lift, base circle runout, duration, along with inconsistencies in ramps. Kevin Enders of Enders Racing Engines in Phoenix, New York, has used the Audie Cam Pro Plus for more than four years to quickly determine the accuracy of the cams he installs. He told us, "We have found many problem cams that would have impacted the performance of our engines if we would have installed them. With Cam Pro Plus I know what I have before it goes into the block. When you are trying to extract every last bit of power from a race engine, even the slightest inconsistency lobe-to-lobe has a disastrous effect on specific output."
Cam Talk
The function of a cam is to smoothly open and close the valves as far and as fast as possible. Smoothness of the profile is paramount in deciding the life expectancy of the valvetrain and its components. Closing force for the valve is applied by the valve spring, but dynamic concerns for valve life need to be ground into the cam to control the speed at which the valve moves. Modern cam profile designs are a computer-generated balance of competing concerns for engine performance, emissions production, specific fuel consumption, valvetrain life, and cost.
A cam profile consists of a base circle, opening and closing ramps, and polynomial generated curves for the opening and closing main events. The terms opening and closing are derived from the direction of the valve travel produced. You may see the terms acceleration and deceleration used instead of opening and closing, but these terms are not technically accurate since the lifter and valve experience both acceleration and deceleration during the opening and closing events. The purpose of the cam is to move the valves (usually by means of intermediate components such as lifters, pushrods, rocker arms, and valve springs) in a manner that will allow the engine to experience an efficient combustion event. The Cam Pro Plus enables you to measure and analyze the shape of the motions produced by the cam along with the velocities, accelerations and jerk inherent in those motions. Before we begin, we need to define a few terms.
Cam Lobe Terms
Ramp: The portion of the cam lobe event from zero lift (base circle) to the defined opening or closing point.
Base circle radius: The portion of the cam contour at zero lift (valves closed).
Flank: The section of the cam lobe between the ramp and the nose radius.
Nose radius: The radius that is tangent to the flank and the maximum lift point. Also, the instantaneous radius at the maximum lift point of the nose of the cam.
Inflection point: The point on the lift curve where acceleration (of the lifter) instantaneously changes from positive to negative or vice versa.
Cam Design Terms
Main event: The portion of the cam lobe profile from the ramp to the nose. There are two main events; one each for the opening and closing halves of the profile.
Velocity: The rate at which position changes. In most instances it is expressed in terms of distance vs. time (mph, feet per second, etc). When dealing with camshafts, time is replaced by degrees of camshaft rotation. This allows the study of camshaft profiles independent of engine speed. The cam follower position in Cam Pro Plus is expressed in units of inch/degree. A metric equivalent can also be displayed in mm/degree.
Acceleration: The rate at which velocity changes. It is expressed in cam logic: inch/degree or thousandths/degree.
Jerk: How fast the acceleration changes. It is expressed in units of inch/degree.
To further establish these terms, consider the analogy of a high-speed train traveling its route. A train at rest in the station has zero velocity, acceleration and jerk. The moment the train starts to move, all three measures increase. Leaving the platform the engineer brings the speed up to 5 mph and holds it there until the train clears the station. During this period velocity is steady (5 mph), acceleration is zero (no change in velocity), and jerk is zero (no change in acceleration). This is analogous to a common cam ramp design known as a constant velocity ramp. Having cleared the station, the train increases speed until it reaches maximum cruising speed. During this period velocity is rising, acceleration is positive (increasing velocity), and jerk depends upon the engineer's skill in smoothly accelerating the train. This portion of the trip corresponds to the opening main event before the inflection point. This being a short run the train must begin to slow down as soon as it reaches cruising speed. During this period velocity is decreasing and acceleration is negative. This portion of the trip corresponds to the opening main event after the inflection point. To complete the analogy the train must begin the return journey as soon as it reaches its destination, which corresponds to the nose of the cam.
Duration: The amount of time in crankshaft rotational degrees that it takes for the lifter to travel from a specified lift point on the opening side of the lobe to the same lift point on the closing side. Unless you know the specified lift point, a duration number does not tell you much. Unfortunately, this is often omitted and there are different standards in use as to which lift should be assumed when the lift point is not stated.
The following are the standards:
Old Pontiac spec. 0.020-inch lifter travel
Aftermarket 0.050-inch lifter travel
Advertised 0.004-inch lifter travel
SAE 0.006-inch valve travel
Since the aftermarket value of 0.050 inch lifter travel is the most common for the readership of HPP, that will be used to explain duration. If our cam is rated at 236 degrees at .050 inch, that means it requires 236 degrees of crankshaft rotation for the cam to move the lifter from 0.050 inch lift to a fully open valve and back to 0.050 inch. The advertised duration, which is measured at 0.004-inch lift, will always be longer than the at-0.050-inch duration.
Now let's consider two cams with identical at-0.050-inch durations but different advertised durations. This would have to imply that the ramp on one cam is steeper (or commonly called quicker) than the other, since the amount of rotation to travel from .050-inch lifter height open to this value on the closing side is the same, but the arc of travel needed to drop down to 0.004-inch lifter displacement varies. Once you analyze this scenario you will conclude that the cam with the lower numerical advertised duration with the constant .050-inch value is ground with a quicker opening. This is established by the fact that it required less rotation of the cam in degrees to bring the lifter down the additional 0.046 inch to the advertised standard. If you engage a conversation with a Pontiac engineer about cams, their standard of including the multiplicative effect of the rocker ratio can really confuse an individual conditioned to the advertised or 0.050-inch method.
Lobe centerline: This represents an imaginary line referenced from the true center of the base circle out to the end of each lobe, in crankshaft rotational degrees. Intake centerline values are found in the crankshafts rotation ATDC, while exhaust centerlines are found at travel BTDC. Lobe centerlines are commonly thought to be the actual mid-point of the flank and are usually close to that, but different ramps on the opening and closing sides may change that reading. For this reason the true center of the cam core is used as a reference. For those who use the intake centerline method for degreeing in a camshaft, you can now see how if the phase of the camshaft is off, it will require a different amount of crankshaft rotation to find this point. When using the intake centerline method lower crankshaft rotational degrees represent the cam being in early or advanced. This statement is correct since in relation to the crankshaft's rotation ATDC, the valve event happens sooner.
Lobe separation angle (LSA): LSA is measured in camshaft degrees and refers to the amount of rotation it takes to travel from the intake centerline to the exhaust centerline. As this number grows, the distance between the centerlines is spread out. Often LSA is considered an indicator of overlap, or the period of time that both valves are open on the same cylinder. Because it is a partial function of LSA, overlap can be calculated with fair accuracy using duration and LSA values. The issue concerning this is you need accurate duration numbers at 0.006 inch to calculate overlap at the industry standard.
The following equation can be used for the approximation of overlap:
For single pattern (duration being equal on both the intake and exhaust lobes):
Overlap = Dur. - 2 X (LSA)
For split-duration cams (different durations on intake and exhaust lobes):
Overlap = Intake Dur. + Exhaust Dur./2 - 2 X (LSA)
NOTE: Non-symmetrical cam lobes will have increased error using these calculations.
Not a single function of LSA alone, overlap is affected by changes in centerlines, ramp designs, and duration. The rumpty-rump sound that we all love in a hot Pontiac engine is the hallmark of overlap. Used to help scavenge the cylinder, overlap is a function of the complete cam design. The use of Cam Pro Plus enables you to quickly and accurately define overlap at any given point.
Base circle runout: A cam that possessed no lift would be round. If given the ability to measure the profile of this round lobe you might find that some spots were higher than others because of a term called runout. On an actual cam lobe, a portion of it is still round, and that is identified as the base circle. This area defines zero lift. A problem arises, though, due to the variation in concentricity. Which value do you take as zero? What Cam Pro Plus does is find the lowest point on the base circle and calls that zero. It also scans the base circle for the highest point. The difference between these two points is the base circle runout.
Cam factor: This value compares the area of a theoretically ideal cam that would have a rectangular lobe to the area of the lobe being tested. If it were possible, a rectangular lobe would be the perfect design, opening the valve the quickest. Obviously the valvetrain could not withstand this rapid deployment. Cam factor is specified as a percentage and is always less than 100% (the ideal cam has a factor of 100%). A higher factor corresponds to a quicker cam profile.
Cam Factor = 100 X (Area of Real Cam/Area of Theoretical Cam)
Area: The summation of the duration X lift at each degree. It is specified in inch degree units. This value is used as a lobe-to-lobe comparison to determine if they are dimensionally similar.
Having It All Make Sense
With camshaft terminology now established, the actual path of the lifter can be represented by Cam Pro Plus. Our subject cam is an Erson hydraulic roller. As viewed in the photo, the cam is mounted in the teststand and spun while readings are taken. Only one lobe at a time can be measured, with the data stored in the PC for review. This cam is represented as a split-duration design with at-.050-inch specifications of 211/219 degrees.
The benefit of a roller design over a flat tappet is the aggressiveness of the opening and closing ramps. Cam designs are a compromise. Since the goal is to have the follower stay in contact with the lobe at all times, roller cams allow this while avoiding excessive valve spring pressures. Due to space constraints we will only review a cam report of one-half the number of lobes and a graph from one lobe. You would use the readout to look for inconsistencies lobe-to-lobe and for accuracy against the cam card. Due to Cam Pro Plus' digital exactness it would be easy to over-criticize the readings. When reviewing this report look for the lowest and highest values and use that deviation to determine the quality of the cam.
The data at the top of the report is numbered 1-8 and identifies the lobe. As an example, position #1 happens to be intake lobe 1 in our test. Past the file name to the right is the amount of base circle runout. We can see that there is a slight variation, with lobe #6 being the highest. Remember that this variation in base circle runout is only .0009 inches (9/10,000 inches), which is quite good. The exhaust centerlines are all within .8 degrees, while the intake side is even better at .4 degrees variation. Lobe separation angles are all within .4 degrees. Below this the report reveals all of the cam data at specified lift points, starting with .006-inch lifter travel to the highest value of .150-inch lift (space did not allow for the publishing of the charts up to the cam's maximum lift of .300 inches). Examining the at-0.050-inch numbers, we can see that Erson is more generous with the intake duration on this cam than it advertises. Listed as 211 degrees at .050-inch lift, this cam is actually nearer 213 degrees.
Note the amount of overlap on this particular sample and see how it varies between different check points. Lobe #8 has the largest variation when viewed at 0.006-inch lift, but comes into line with the other lobes by 0.020 inch. Erson was not aware that HPP was going to test this cam for accuracy when it was sent to us, so these results are representative of a consumer grade unit. The uniformity of this grind with all values being nearly identical speaks very highly of Erson's quality control. You would be able to install this cam with confidence.
Reviewing the Dynamics of Lifter Movement
Another aspect of Cam Pro Plus is its ability to graph the values of velocity, acceleration, and jerk. The graph is a plot of these values, and much like an oscilloscope is a picture of an electrical signal, this is a point-by-point viewing of the previously mentioned areas. It most likely will be confusing at first. While reviewing the graph keep in mind that it is a dynamic drawing of the lifter's movement in three different categories. For ease of explanation, reference the following with the graph. Keep in mind that this is a plot of one lobe with the lifter riding from the base circle up the nose, over the top, down the closing ramp, and back on to the base circle.
The flat line to the left is the starting point for velocity, acceleration, and jerk; and lifter is on the base circle of the cam here.
V) The velocity curve: The top of the graph (V1) represents the peak velocity of the lifter. This event usually occurs halfway up the curve. At this point the curve turns down (V2) since the lifter is still moving, but it has slowed down from its peak velocity. At (V3) the velocity is "0" and that is where the lifter actually stops just as it crosses the nose of the lobe. At (V4) the lifter is speeding back up but in the opposite direction since the valve is now racing closed. The lowest point on this graph is (V5), where the lifter has reached maximum velocity on the closing ramp. The lifter then starts to slow down as it approaches the base circle of the cam, which is at point (V6), and at (V7) it made one complete cycle and is back to riding the base circle.
A) The plot of the lifter's acceleration: (A1) crosses over on the velocity curve since peak acceleration of the lifter occurs halfway up the velocity curve. At (A2) the lifter is still accelerating, but not as quickly, which is represented by the downturn of the slope. At (A3) the rate of acceleration is zero, but remember that the lifter is still moving, it has a constant velocity. At (A4) the lifter is now slowing down, getting ready to change direction right after riding over the nose of the cam.(A5) is peak lifter acceleration on the closing ramp. At (A6) the lifter has arrived at the base circle and the acceleration is zero.
J) The jerk curve: Plots the rate of change in acceleration of the lifter. Used more as an aid in reviewing a cam's profile, the curve has no characteristic shape to it. It is used to look for smooth transitions of acceleration with no high sudden jerk changes. This cam represents an acceptable jerk curve, which would be gentle on valvetrain components.
L): Represents the lift of the cam follower.
Conclusion
Do not be discouraged if the Cam Pro Plus graph is confusing at first. Just remember it is something that you have never seen before and is a plot representing movement in terms of velocity, acceleration, and jerk. The valve lifter takes a ride along the cam much like a Pro Stocker down the track. It experiences a violent start and then reaches peak velocity halfway up its velocity curve, which would be like a drag car with too much gear running out of breath at midtrack. It reaches peak acceleration at the same point of peak velocity. It then slows down as it approaches the nose in preparation of riding over the top. At peak lift it actually stops and then accelerates up to peak velocity down the closing ramp, racing to shut the valve.
Cam Pro Plus is a very powerful tool that can be used to quality control cams but to also design and compare grinds of your own or from different manufacturers. Priced at $2,900.00 for the complete package, it is an essential tool for the serious racer and engine builder. Once you have used this equipment you will never feel comfortable installing a cam without a complete report.
Laptop Dynos
While understanding the aspects of a camshaft is paramount to building high-powered Pontiac engines, the data from the cam inspection system will only tell you what the valve is doing, not its effect on the engine. We need to be able to easily quantify how a cam profile will work in an engine. Thanks to the age of computers this is readly accomplished with software marketed by Audie Technologies called Dynomation. The brainchild of Curtis Leverton, Dynomation is a wave dynamics engine simulation program that can work in conjunction with Cam Pro Plus. This will allow new cam profiles to be tried without ever being installed in the engine. There are many different engine simulation softwares on the market, but Dynomation has been accepted as the superior technology due to its foundation on wave dynamics. Audie Thomas is very familiar with this program since he wrote the computer code for it. Priced at $600, Dynomation is the ultimate in software for the professional engine builder or serious racer. A form of Dynomation is available in a less powerful racer and hobbyist version, marketed by Mr. Gasket under the name Desk Top Dyno and retails for under $75. With technology like this there is no excuse for having a garage full of parts that don't work. --RTB