You can say you can feel the power of your latest performance mod coursing through your veins. You can quote the manufacturer's estimates, but the bottom line to knowing the extent of your car's power is the chassis dyno.
Dyno testing is the ultimate measuring stick, but you have to know your engine's behavior, how the parts you add are designed to generate power and how to look past the peak when evaluating the performance of a given part or battery of modifications.
Powerband Identification
When you're driving your car in a spirited fashion, what's the engine doing? When you shift, where does the tach needle fall? Using our Project Code Name SE-R (the project car formerly known as SE-Rious Sentra) as an example, let's get a rundown on the revving habits of its SR20DE.
 | How To Read A Dyno Chart
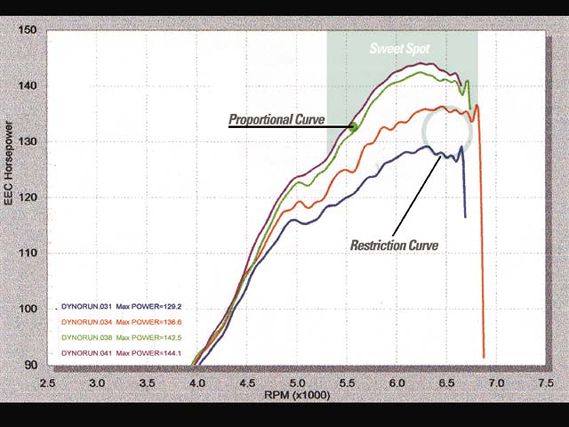
 This is pretty straightforward. Get on the throttle until 7000 rpm and shift. Eyeing the tach, we observed the needle drop to 5100 rpm. Shifting at 6500 rpm netted a drop to 4900 rpm. So our engine's "sweet spot" is in the 5000-rpm to 7000-rpm range. This fact is proven on the dyno, where we see the power curve develop a real aggressive arc at this point in the pull.
Parts Have Power Targets
Now that you understand the habits of your engine, you need to know what to expect from the parts you add-not just how much power they generate, but where in your engine's powerband this power will be realized.
For instance, there are what can be called efficiency parts like intakes, headers, high-flow cats and exhaust systems that address restrictions in the OEM components they replace. This type of component should impact top-end power. Since a restriction becomes more apparent the higher the engine revs, these performance parts see gains in the mid to high ranges.
Cams are a different animal. The design of a cam's lobes dictate where in the powerband the bumpstick will make power. A more aggressive grind translates into a cam that delivers the goods higher in the rev range. Looking to get cams for your street car? A set of race cams designed to make power from 7500 rpm to 9000 rpm would be a disaster.
Talk to the manufacturer about where its cams will make power and be sure the bumpsticks you buy match your engine's behavior.
Power pulleys make power constantly. By virtue of weighing less, their reduction of rotating inertia is evident at all engine speeds, so the curve is merely bumped up in a proportionally equal amount throughout the measurable powerband. This proportional phenomenon can also be seen in some ECU ROM tunes that optimize the performance of a collection of components.
Turbos make power everywhere, but turbine housing size and wheel trim will affect how quickly the peak is reached. The maximum boost and efficiency of the compressor wheel will also affect the ultimate power produced by the system.
Factors such as intercooling efficiency, fuel enrichment capabilities and tuning will also be felt on the bottom line. The dyno graph allows the tuner to see how quickly the boost is being made, how much power is being made so he can make changes to A/R ratios, compressor wheels or entire turbos to realize the correct power curve for a given engine.
 | How To Read A Dyno Chart
 Look Past the Peak
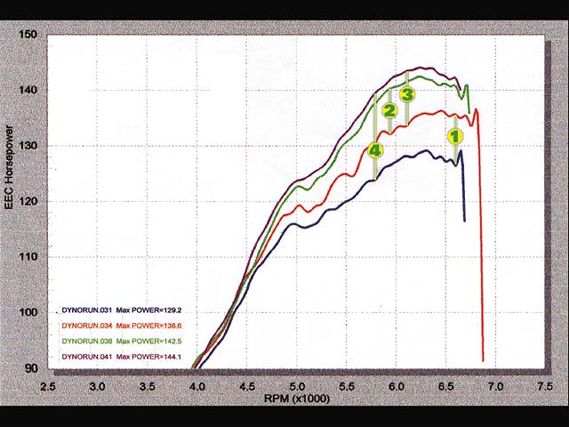
Since power parts can affect different sections of the power curve, looking at only the peak output number shortchanges the true value of the product. On our example dyno chart, note how the green line (cams) makes a strong improvement from 5000 rpm and up, compared to the red line (header). This is a well-matched set of cams, as the power is delivered from 4500 rpm on up; right in the sweet spot.
Note the purple line (ECU tune) and how it illustrates the proportional gain we talked about earlier. Check the accompanying chart and you'll see the biggest power gain of a given mod is oftentimes not at peak output.
A jumpy, skittish line may indicate an overwhelmed ignition system or fuel enrichment problems. As the stakes rise, it would be wise to use a dyno with air/fuel ratio readout capabilities. Competent tuners know what ratios are safe for the type of engine and level of modification of the engine. For anything short of forced induction, it's unlikely you'll see a jumpy power curve.
The key here is to have realistic expectations, know your engine's sweet spot and remember to look at the big picture, not just peak output.