| tips For Sizing Your Turbo fan
Somewhere between the boosted Cummins B-Series that roamed the streets long before mags like this one graced the newsstands and the exponentially more powerful Duramax drag mills of today, the lost art of turbo sizing had become exactly that-lost. Proven mathematical formulas have been kicked aside as some struggle to inadvertently secure their manhood through oversized compressors strapped to daily-driven work trucks.
Unquestionably, turbochargers are not one-size-fits-all, bolt-on power solutions and, in our case, size does matter. What works well for one engine combination likely won't work for another, despite seemingly equal displacements and engine speed characteristics. Requirements often vary depending on the engine in question. What's important: top-end power or low-speed torque? How about a broad power curve and long-term reliability? What about acceptable trade-offs: some turbo lag, maybe some added heat or low-end torque loss? Before shelling out for that basketball-sized compressor you've been eyeing, be sure and run these questions through your head.
Compressor SizingChoosing the right compressor is arguably the most important part of turbo sizing and perhaps the most often bungled. Assuming a basic level of understanding as to what the turbocharger's chilly side actually does, we'll forgo the turbo anatomy lesson and jump right into sizing details.
Ideally, you want the most efficient compressor; not the biggest or shiniest, but the one that can pump the most air into the cylinders without raising temperatures more than complicated thermodynamics laws say it should. For this, most turbocharger manufacturers supply us with compressor maps, graphs that assist us in compressor sizing by providing efficiency, surge limit, boost potential and shaft speed data. But before we look at these maps or arrive at an ideal efficiency zone, we first need to arm ourselves with two figures: the proposed boost pressure ratio and the given engine's airflow rate.
Determining an engine's boost pressure ratio is the easy part, but it requires a reality check. First, the calculation: The pressure ratio is simply the proposed absolute outlet pressure divided by the absolute inlet pressure. Restraining yourself to a realistic boost figure may prove more difficult than the calculation itself. Start with realistic numbers, say 20-30 psi for street trucks on diesel only and upwards of 120 psi for race applications. The key is being a realist. Sure, you know you want to show your friends the 60 psi-capable pressure cooker under your hood. The key is being a realist.
Airflow is a bit more complex and, unlike boost pressure, you can't pull this number out of your hat; it is what it is. Airflow measures how much air enters the engine for a given period of time and can be quantified at a given rpm if you know the engine's displacement and volumetric efficiency (don't feel bad if you don't; see the attached calculations). With honest pressure ratios, calculated airflow figures and a compressor map, you'll have to try real hard to not end up with the right compressor.
Each compressor has a boost pressure and airflow point at which it works best and often times, more than one will seem to work. The key is matching a given compressor's maximum efficiency point to the most useful part of the engine's rpm range, typically its peak torque point. Plotting based on the maximum horsepower point will do little for daily-driver performance. For the best possible turbo response, midrange and top-end power, compare compressor efficiency at multiple rpm points. It's best to plot a map at redline and another at, say, 70 percent of redline, near where the compressor may potentially hit full boost. Fortunately, we have those nifty aforementioned compressor maps for this. These charts aren't too far off from something you'd see in your high school math class; they display compressor efficiency by expressing the boost pressure ratio along the map's Y axis and airflow ratings along the X axis. A number of oval-shaped islands within the graph represent different efficiency zones. Any given boost/flow point plotted on an island will yield an efficiency point, ideally as close to the center island as possible with efficiency decreasing as points move outward. Where the two points intersect on the map represents the maximum amount the compressor can flow in the proposed situation. Compressor efficiency is a percentage, with most peaking in the 70-percent range. Stay above 60 percent, and you're in good shape.
It's important to note here that, contrary to popular belief, compressor size affects turbo lag little. Lag is mostly associated with the speed at which the shaft spins. In other words, the turbine wheel. But that doesn't mean there aren't consequences from an overzealous compressor selection. As compressor size increases, efficiency drops and heat rises, never a good thing for performance. Sure, 30 psi is 30 psi, no matter the size of the turbo, but while air quantity may be equal, air quality differs between varying turbos, as will power. As a turbo loses efficiency, it produces less dense air which, in turn, yields less volume of incoming air for the engine to inhale.
SurgeThere are two places you don't want to end up on a compressor map: the choke point and the surge point. Points to the right of the choke line represent the lowest efficiency points, excessive shaft speeds mean a larger compressor is in order; pretty straightforward. Points to the left of the surge line are bad news and require further explanation.
You'll recall we mentioned that compressor maps may reveal numerous candidates fit for the job. Selecting the most efficient one will also be the one with the lowest surge airflow limit. In case you didn't know, surge is bad and its consequences range from a slight power loss to severe bucking and jerking. This occurs when the engine is unable to inhale what the compressor wants to feed it. As a result, air backs up in the intake tract and inside the compressor, in turn, wielding itself furiously against the compressor wheel-not a good thing for those turbo thrust washers. Surge may sometimes be identified by a chattering sound mistaken by many a newbie for a blow-off valve. As far as compressor maps are concerned, be sure and select a compressor that stays to the right of the map's surge line.
| Like A/R, trim options allow for yet another way to custom tailor a turbo to specific needs. For the most part, as trim size increases so will flow.
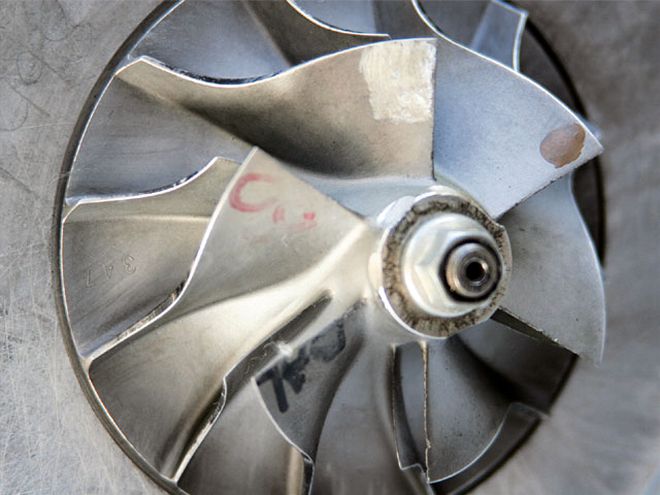
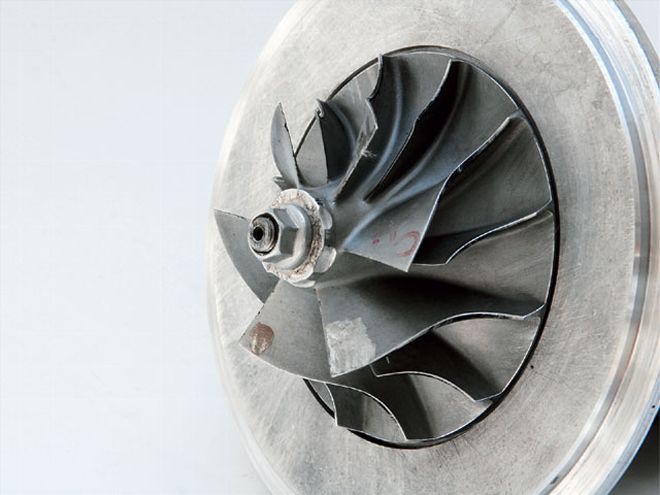
TrimTrim is the relationship shared between the minor and major diameter of a compressor or turbine wheel. On the compressor side, these are referred to as the inducer and exducer, respectively, and vice versa for the turbine. Its calculation is simple and its results influence a turbo's flow characteristics. For the most part, larger trims equal more flow, assuming all else remains constant. As expected, there are tradeoffs as far as trim selection is concerned. When dealing with compressor wheels, larger wheels are generally less efficient. The solution is to increase trim size without increasing the overall diameter of the wheel. As for turbine wheels, bigger trims will reduce backpressure at the expense of increased spool time.
A/RA/R ratios are ways of further sub-classifying compressors, as well as turbine housings, by offering differing flow characteristics within equally sized housings. The A/R is calculated by dividing the inlet (compressor) or discharge (turbine) diameter's cross-sectional area by the distance between the center of the wheel's shaft and the center of the measured inlet or discharge area. When calculated correctly, the A/R ratio will remain constant throughout the housing. Varying the A/R affects compressor performance little but the same cannot be said of turbine housings.
Turbine SizingWhile the compressor brings the air in, it's the turbine that actually powers the compressor wheel through a shared shaft, but you knew that so let's get back to sizing. Because of this relationship, smaller turbine wheels spin the compressor wheel faster and vice versa. While keeping that compressor wheel spinning fast can be a good thing, small turbine wheels/housings can prohibit exhaust gas flow, causing buildup between the combustion chamber and the turbine, also known as backpressure. Despite all this, there's some leeway here on turbine sizing, unlike the finicky nature of compressors.
There are two things to consider when selecting a turbine: size and A/R. In most cases, turbine sizing is dependent upon its exducer bore size; a larger bore will potentially yield more power. The key is keeping the turbine wheel diameter within 15 percent of the compressor wheel's. This 15-percent relationship is clearly illustrated in many of the popular T3/T4 combinations that have proven time and again to work well on small-displacement engines.
On turbines, the A/R is just as important as turbine size. You should care about the area part of the equation because it dictates how well exhaust gases are evacuated by maintaining their velocity. Erring on the small side might get you a faster spool-up but can lead to reversion back into the chambers. Upsizing will yield some more ponies on the top-end but at the risk of a late spool-up, or worse, no spool-up. The radius portion of the equation is important in that it influences turbine speed. Increasing the radius supplies the turbine shaft with additional torque for turning the compressor wheel. While this may seem like a sneaky way to stuff a larger compressor wheel in place, most turbine radiuses are fixed and experimentation lies mainly with turbine area. Perhaps the best way to select the proper A/R ratio is from experience. There really is no magic calculation here. Too many factors are involved, including exhaust gas pressure, turbine inlet pressure ,and boost pressure.
The bottom line: There's no longer any reason to consider turbo sizing black magic. With a few compressor maps, a pencil, and a calculator, there's just no excuse for hooking up that oversized, boost-lagging, beast of a turbo and feeling good about it. Despite what they say, size does matter.
How to plot points on a compressor map:Calculate airflow for the X axis:
measured in lb/min, airflow = (HP target) x (air/fuel ratio) x (BSFC/60) where BSFC is lbs fuel / (hp x hr)
If you don't have access to BSFC data, you can plug in an estimated value between .50-.60.
Calculate volumetric efficiency =
(actual CFM / theoretical CFM) x 100 where theoretical CFM = (RPM x CID) / 3456 and actual CFM = 90%, a good average number if you don't have access to measuring this. Multiply by .0610237 to convert cubic centimeter displacement into cubic inches.
Calculate manifold absolute pressure:
map = [(airflow) x (639.6) x (460 + intake temperature)] / (VE) x (RPM/2) x (CID) Upwards of 100 degrees F is a good estimate for intercooled intake temps if you don't have access to measuring this. Plan on adding about 1psi to take into account pressure drops related to the intake and/or intercooler.
Calculate pressure ratio for the Y axis =
(14.7 + map) / 14.7 If you're at sea level, 14.7psi will work. As elevation varies, this figure will need to be adjusted.
Note:Don't worry about the constants like 3456, 60 or 639.6, they're simply there to tidy things up and convert units.
VE= volumetric efficiency
BSFC= brake specific fuel consumption
HP= projected flywheel horsepower
CFM= cubic feet per minute
CID= cubic inch displacement
Other Useful Calculations:Trim describes the relationship the minor diameter and major diameter of a compressor or turbine wheel shares with each another. The inducer, or minor end when referring to compressor wheels, is where the air enters. Air exits through the exducer portion.
Trim = (minor/major) squared x 100