 | Virtual Dyno is Brad Barnhill’s freeware contribution to the tunerverse, allowing fellow go-fast enthusiasts to easily turn data logs into accurate dyno graphs.
So I’ve been spending a lot of time online lately, and not just for my usual searches for cool car videos and vintage pornography. If you’ve been following Project RX-8’s progress at all, then you know we’ve been tuning the ECU via MazdaManiac’s unique online calibration service rather than going with the usual rent-dyno-time-and-hire-a-local-ECU-tuner approach.
Since we haven’t put the RX-8 on a chassis dyno (yet), getting a sense of how much power the newly rebuilt Renesis rotary engine is making led to some research into data loggers that provide a power estimate or even a dyno graph. The Cobb AccessPort we’re using to tune the factory ECU does, in fact, have a dynamometer feature that provides a wheel horsepower and torque estimate, but the numbers it reported were wildly optimistic. Conversely, the power estimate provided by our Vbox Driftbox data-acquisition system was rather pessimistic, which left us feeling like accurate power estimates using data loggers just wasn’t in the cards.
Then we came across Brad Barnhill’s freeware program called Virtual Dyno (downloadable at BradBarnhill.com/ projects/VirtualDyno/). I spotted a thread on a Mazdaspeed3 forum about Virtual Dyno, and from there I found other threads confirming that Virtual Dyno was generating nearly identical peak numbers and graphs to a wide variety of chassis dynos. This intrigued me enough to download the program, only to discover I couldn’t run it on my Mac.
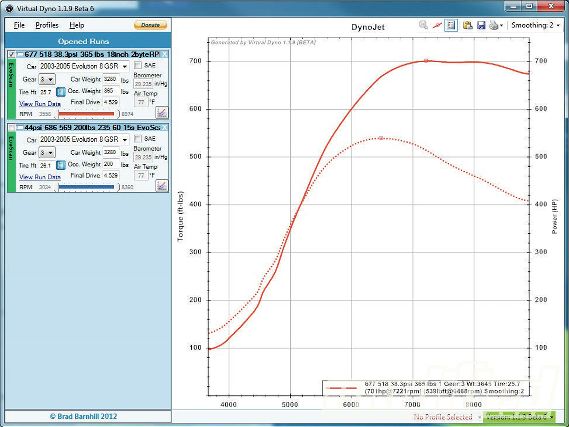
 | My first attempt to use Virtual Dyno required us to modify the MX-5's parameters to better simulate the RX-8's. The resulting graph looked very promising both in terms of its peak power numbers and curve shapes.
No matter, though, because a quick call for help on Facebook, and my friend Travis from Snail Performance volunteered to graph the wide-open throttle runs I’d made in Third gear using Virtual Dyno on his PC, at which point we learned that the RX-8 wasn’t among the cars included in the software’s database (but a lot of popular tuner platforms are there already, including most Subarus, Mitsubishis, Mazdas, and Hondas). So for starters, we graphed the log using the Mazda MX-5 and then changed some key parameters like vehicle weight, gearing, final drive, and tire diameter. The result of that initial experiment was encouraging because the peak power and overall shape of the horsepower and torque curves looked to be spot on for a Renesis engine like ours.
Impressed by this initial experience, I contacted Virtual Dyno’s proud papa, Brad Barnhill. It turns out Brad is a software engineer by trade, having worked in several sectors including the automotive aftermarket tuning arena. He’s also a modified Evo X owner, so you know he’s our kind of guy.
Virtual Dyno is a side project for Brad, and a nonprofit one at that. Brad says, “I saw the community struggling with expensive dyno time and simple spreadsheets to show the horsepower and torque from their logged data. I knew there had to be a better way. I started talking to a few local tuners, and the general consensus was that there needed to be an easy-to-use tool for the masses. I figured it was the least I could do for the community to give it a try. In the beginning it was very crude and very simple. The user interface was not very intuitive, and the public thought it was just another tool that would stop being supported and wasn’t going to give them everything they wanted. I stuck with it, though, and listened to the community and collaborated with every tuner I could find that was willing to provide feedback. I tested against numerous dynos and numerous vehicles. To this day, I’m engaged in a continual improvement process to make the program better, one line of code and one suggestion at a time.”
If you’re not a fan of Brad at this point, please stop reading, punch yourself in the face, and trade in your car for an electric scooter. The rest of you will be interested to know that Virtual Dyno is now extremely easy to use. All you need is one of the 40+ ECU/data loggers supported by the software (including Cobb AccessPort, Hondata, GReddy eManage, AEM, Chrome, MegaSquirt, EvoScan, Neptune, and even MoTeC), a flat piece of highway you can safely perform wide-open throttle runs on (in whatever gear you can without having your license taken away, but ideally in the gear with the ratio closest to 1:1), and a PC capable of running the Virtual Dyno software.
| Mellon Tuning’s 700-whp Evo graphed using Virtual Dyno (left) and on a DynoJet chassis dyno (right). As you can see, the results are basically identical.
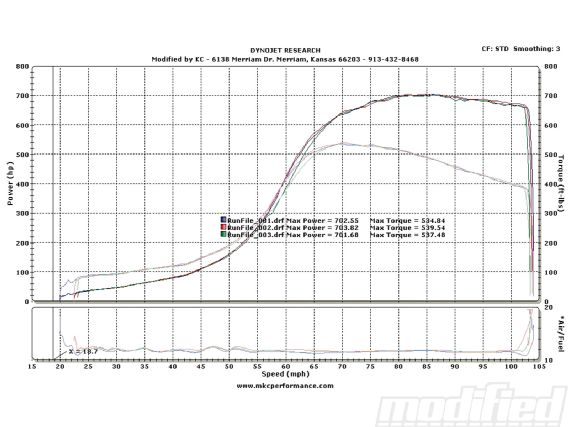 | On a Dynojet chassis dyno
As Brad added, “On my Evo X, I log from about 2,500 (right before boost kicks in) to redline. I only go WOT in one gear in the run, but you can shift, just don’t go WOT except in one gear, otherwise it will be a funky graph due to the software expecting one gear WOT and it trims the rest out. Obviously the flatter and smoother the road used the better. Potholes can cause wheel spin and spikes in the graph. Clutches slipping or any drivetrain slippage will cause spikes. So really, you just need to use good dyno techniques.”
In terms of what data to log, the bare minimum needed to generate a graph using Virtual Dyno is Time (which all loggers automatically record), RPM, and Throttle Position or Accelerator Pedal Position. If you also log boost pressure (for forced-induction cars) and air/fuel ratio (AFR) or equivalence ratio, Virtual Dyno will graph these beneath the main HP and TQ graph. Then it’s just a matter of opening the log file in Virtual Dyno, selecting your vehicle from the ones listed (if yours isn’t included, shoot Brad an email and he’ll add it for you), selecting the gear the log was collected in, and making any required adjustments to key variables such as tire diameter and final drive (if you’ve modified these from the OEM specs used in the software).
With those selections made, Virtual Dyno will generate a power graph. And just like on a chassis dyno, you can choose to display the graph in SAE standard, adjust smoothing from 0 to 5, and you can even change the graph from DynoJet equivalent to Mustang equivalent (since Mustang dynos read lower than DynoJets). Use the same piece of road every time you take a new log, and your results should be very repeatable, just like they would be on a chassis dyno.
Of course there are pros and cons to using the street to generate WOT data logs that can be imported into Virtual Dyno, but there are also pros and cons to using a chassis dyno. On the street, your car’s engine is put under real-world loads and conditions, making it the most realistic environment for tuning your ECU’s fuel and ignition maps. A chassis dyno, on the other hand, allows you to make a lot of WOT runs in a short period of time without worrying about a deer running out in front of you or the police taking notice. But on a chassis dyno, you don’t get real-world airflow into the air intake or through the radiator, so although a good chassis dyno can simulate real-world engine loads with amazing accuracy, it can’t replicate airflow. And as Brad pointed out, renting time on a chassis dyno isn’t cheap, while data logging and tuning on the street is free.
 |
A Digital Dynamometer - Tech Talk
|
A Digital Dynamometer - Tech Talk
For those of you on a tight budget or without access to a chassis dyno, Virtual Dyno offers an accurate and easy way of generating dyno graphs from data logs, not only allowing you to evaluate your engine’s performance but also to track any gains/losses as you make modifications to it. Barnhill for President? I think so.
Send your feedback to PlanetDave@me.com