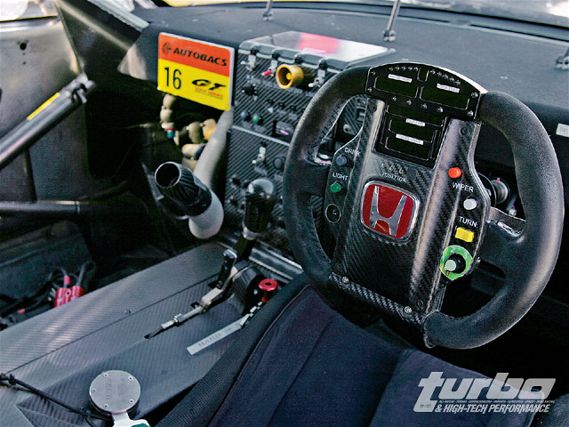
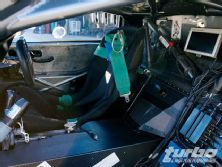
 | Cockpit of a M-Tec Prepared Super GT car, EFI Steering wheel dash display, and Level 4 logger on hand to collect and display information
Squiggly lines, distance plots, time plots, frequency plots, histograms, X-Y plots, 3-D plots, constants, math, and many other tools are the way we make sense out of data collected. In the last article we discussed the tools for collecting data, sensors, wiring looms, loggers, and dash displays. In this installment we will discuss what we can do with this data using EFI Technology's analysis software.
One of the most important steps in analyzing data is to be organized. You can have all the data in the world, but if you don't know what track you will be competing on with a specific driver in a certain car, in the end that precious data is worth nothing.
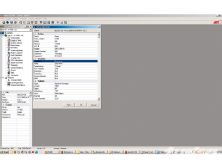
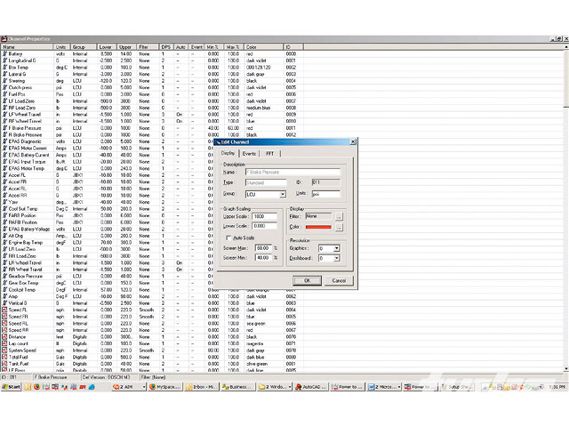 | Channel Properties window, displaying channel data, and configurable settings for the displays
Depending on the how critical your data is, sorting the data into an easy-to-find manner is a good place to start. Typically it's grouped a few different ways (event, track, day, session, data set). For example, when you're looking for the fastest lap from Practice 1 at Sears Point in 2004 during the sixth hour into the race it's not going to take you days to track down the information.
Most data systems will have a setup sheet, outing info, or some type of sheet that will ask for a variety of information. The sheet may contain simple things like track, engine, weather, vehicle, or chassis setup (see the image of the setup sheet).
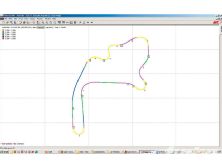
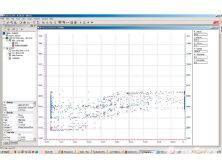
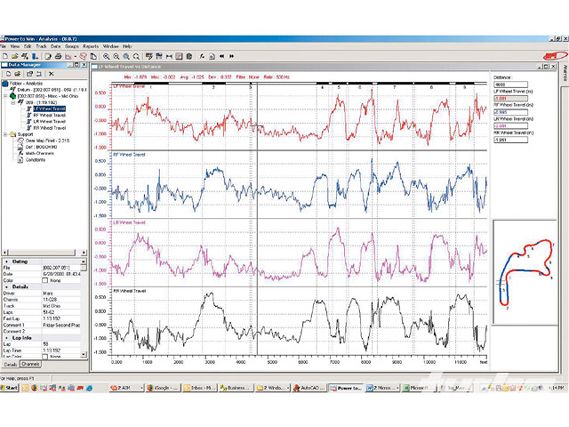 | A basic distance plot showing four channels of wheel travel through one lap, not the position of the cursor on plot and the loaded track map
It's also highly recommended to collaborate with your engineer to do a session log. A session log will typically highlight the standard setup variables of the vehicle and the goals of the session. By keeping a session log you will be able to see that when the car came in on lap 48, and the front camber increased by negative 0.5 degrees, and the rear wing gurney went from half an inch to five-eighths of an inch,so there was a definite change. When analyzing your data later, you will know when the key changes occurred and will be able to quickly get to the data to figure out why the car went faster.
So now we have collected some data, organized it, and we are ready to start going faster, right? Not quite yet. Let's first cover the simple basics of what we are going to be doing with the data. Most data systems will have the sensor information sorted into channels, these channels will then be sorted into groups such as analog, digital, or onboard math. So what is a channel? Simply stated, a channel is the data that was collected on an assigned input. For example Analog 1 is a channel, but what channel? Typically the channel properties will be modified to give the input some meaning and to apply a calibration to the raw bit value that we talked about in the past article. Channel properties can be color, scaling, units, group, resolutions, and applied filters. A channel properties window and channel data window is displayed in image 2.
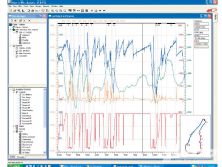
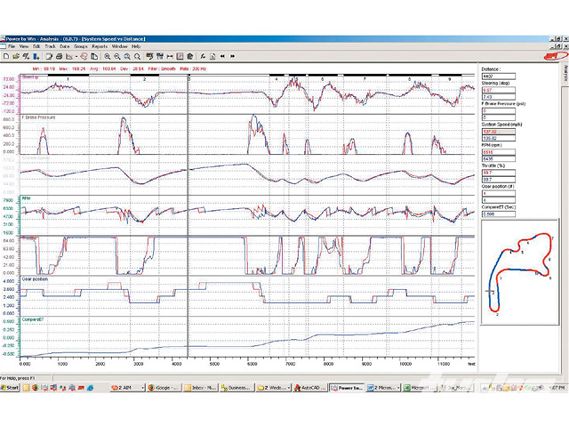 | Another distance plot being used for driver evaluation, the compared laps have been color coded, the "Compare e.t." channel is being displayed to show where the most time has been lost and gained, with the track map loaded
OK, we have channels, we have set their scaling, colors, applied filters as necessary, and made the calibrations to convert bits into engineering values, so now what? We look at it, but how? There are many different ways to look at and interpret the data so we are going to start off with the two most basics: plot time and distance.
Even the most basic analysis packages will include a simple time plot. You will have time as your X axis and your channel values as the Y. Typically there will be a "tiled mode," that will automatically evenly display the channels, or you may be able to set your own scaling. There will also be the standard overlay mode which will have all of the channels on one plot. Most plots should include basic information about the channel selected-minimum values, maximum values, average, standard deviation, filter, and the rate the channel was logged at. This will save a large amount of time looking for the basic questions. An example would be if you're looking at shock travel and wanted to see if the shock is bottoming. Depending on how you've zeroed your sensors, you can simply look at the minimum value and you know that below X value the shock has bottomed, or hit the packers.

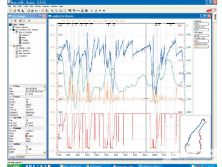
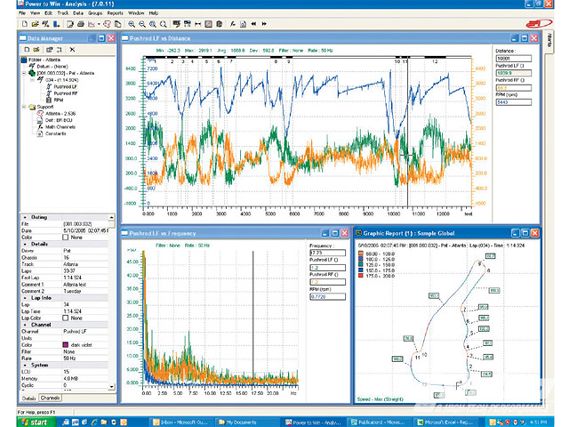
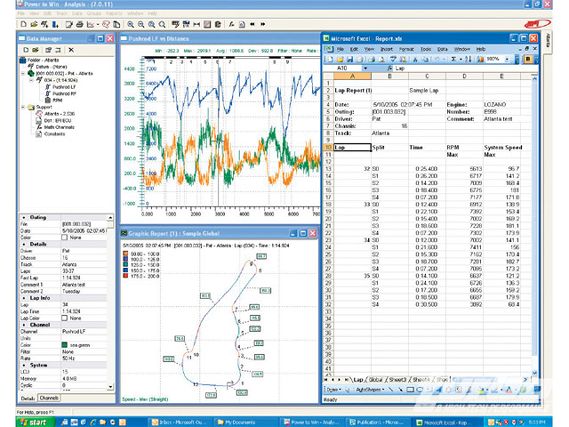
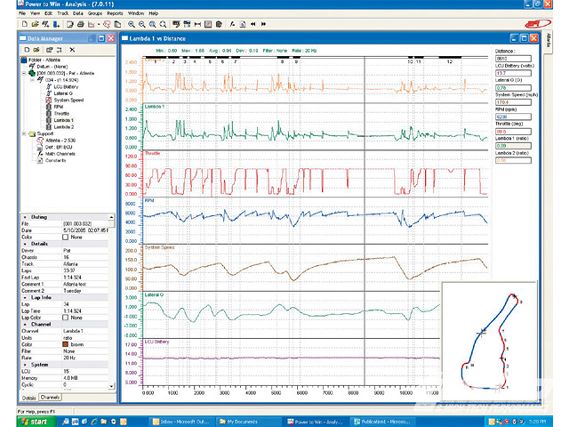
 | Distance plot with some engine and suspension load data, track report, and an excel based lap report.
The same can also be said for the distance plot with the exception of when a track map has been implemented, the corners will typically be marked so that if you find a problem area you will know where it occurred on the track.
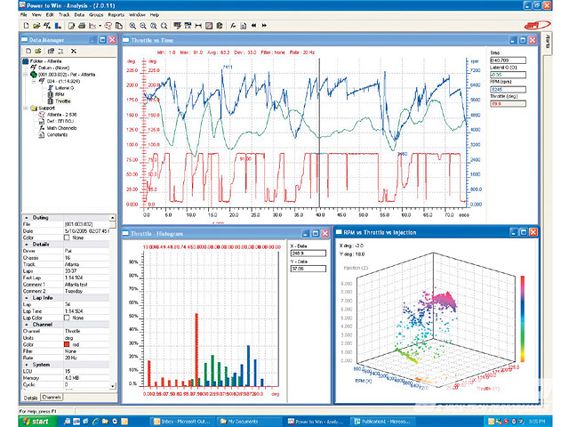
The X-Y plot, while less common, has a huge variety of functionality and with the proper engineering talent, can become a very powerful tool. A simple but applicable use is illustrating the reason for a throttle/rpm-based fuel map. An example is when you plot two specific parameter (rpm and throttle), you can see that at the same rpm and throttle site the airbox pressure will vary upwards of 5 in Hg. This illustrates that if a throttle-based fuel map is used, then a pressure compensation must be applied to counterbalance the actual total airflow.
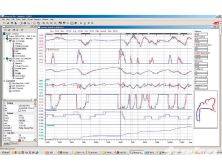
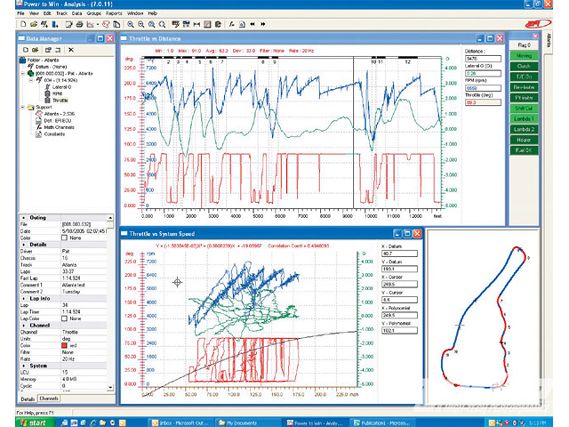
 | A simple distance plot with engine parameters and lateral g displayed, an X-Y plot with mph as the X axis, bit indicators are also used to display the states of certain channels.
The uncommon histogram is not the most popular tool but a useful one none the less. A histogram plot is a bar chart that shows how much time a channel spends at a variety of selected values. Histograms can be used to visualize the distribution of a particular channel, and can even be used with the rpm channel to determine where peak power is delivered.
While more complex frequency plots should be an integral part of your analysis package. Viewing data in the frequency domain is useful in identifying events in the data that occur at specific frequencies, like the natural frequency of the suspension.
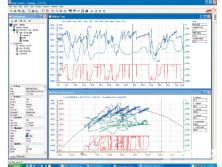
Probably the most unique function of high-end analysis packages are items like a 3-D plot. The 3-D plot can be used for a variety of different assessments, however, we wanted a real-life application, so we turned to the experts at Angerole, a full-time motorsports consulting business. Ron Mathis, the head engineer at Angerole, replied with a wonderful example of putting the 3-D plot through its paces.
 | Tiled distance plot with engine information displayed
One useful tool that this analysis packages may include is the ability to produce a variety of visual track reports. A common one produced at the track is called a Gear Map. These are typically used when doing driver training or getting a driver up to speed at the beginning of the weekend.
Math channels and functions and a good analysis package will allow you to easily create math functions. These math functions should include the ability to nest channels within channels because this will allow you to perform math on an actual math function. Some basic math functions that can be easily done are:
 | Setup sheet attached to the data file, complex entries like weather and chassis information
These are simple math channel examples and should be treated as so. Some more complex math channels that we will not provide formulas for but simple verbal examples are: understeer gradient, aero load, load percent front, load total, wheel lockup, and wheel slip. As long as you have the required inputs most good analysis packages will allow you to process it into something useful.
Some data systems will offer onboard math channels, since these math channels are processed onboard they can be sent over a car's telemetry system back to the pits. This can allow engineers to make quick and concise setup decisions without having to download the car.
 | Airbox pressure and rpm displayed on a X-Y plot with throttle angle as the X axis
Telemetry systems, while most will never get their hands on a timing stand, a set of radios, and a data system capable of telemetry, it's probably about the coolest damn thing we have ever played with. So let's see, we are going to monitor almost 100 channels and then we are going to send them over a radio back to the pits so that we can watch in real time? You can imagine now that the possibilities are endless.
With experience, organization, and a lot of patience, data that was once squiggly lines and a pain in the ass to find anything on, will become one of the most useful tools for quantifying any amount of money that you will spend in racing.
We'd like to extend a special thanks to Angerole, Riley Technologies, and EFI Technology. Your aid and input was much appreciated and helped make this article possible.
 | EFI Technology's Data Acquisition - Bits Byte Back
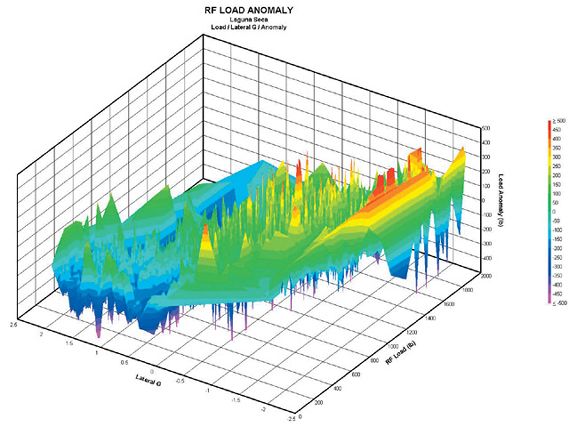
The Value Of 3-D Graphing
Here's an example of how a race engineer might use 3-D graphing. Here's one of my favorite examples, collected on EFI equipment mounted in a Crawford Daytona Prototype.
On this car at Laguna Seca we were struggling for front grip and noticed in the load data what might have been signatures of friction in the front suspension rocker assembly. As often happens, the problem was trying to convince an unbelieving team owner what was happening. When we graphed the data in 3-D, the picture became a lot more clear.
What you see in the graph below on the horizontal axis is a plot of the vertical load of one front-wheel load against Lateral g for a whole lap of Laguna Seca. This generates, as would be expected, a strip of readings that follow a surface diagonally across the graph from left to right.
Where it gets interesting is when we put load anomaly on the Z-axis. Load anomaly is one of our calculated channels that compares actual measured suspension load against what you would expect, given the wheel's position. It's a neat way to simulate a shaker rig on the actual car.
In this case, the load anomalies show up as long spikes, a classic indication of large short-term reluctance to move: we had lots of stiction/friction, which turned out to be caused by deflection and binding of the rocker pivot.
You'll notice the graph below is not in an EFI Window. In fact, it was generated by exporting EFI data to Excel and then exporting that into specialized graphing software. That was so time consuming that we asked EFI to incorporate 3-D graphing into their software and, uniquely amongst data system manufacturers, they did it. I wholeheartedly recommend EFI's products.Ron MathisAngerole, Inc
Name Engine Rate Syntax Deriv (rpm / 60) Channels rpm Definition The rate of change of engine speed Name Brake Bias Syntax F brake pressure / (F brake pressure + R brake pressure) x {{{100}}} Channels Front and rear brake pressures Definition The ratio of the braking pressures front to rear Name Heading Syntax Integ (Gyro) Channels Gyro Definition Integrating the gyro channel returns the heading of the vehicle Name Compare e.t. Syntax Delta (elapsed time) Channels Elapsed time Definition The cumulative time difference between the datum and current lap Name Gear Ratio Syntax (rpm / 60) / (speed / (0.680 x 3.1415) Channels rpm and speed Definition The ratio of speed between the engine and driven wheels Name Ride Height Syntax (FL damper + FR damper + {{{RL}}} damper + RR damper) / 4 Channels Vehicle dampers Definition The simple definition of vehicle ride height