 | How To Read A Compressor Map - Turbo Tech
 When it comes to building boost, compressor wheel selection is the make-or-break decision facing the pressure-craving enthusiast. Too often ego enters the equation and when starry-eyed enthusiasts run big wheels, performance is the loser.
First, you need to be logical and realistic. Second, you need a compressor map to get a ballpark idea of what wheel will best fit your application.
A compressor map is a snapshot of the wheel's efficiency laid out on an X-Y axis graph. Let's break down a map by the numbers and plug in some hypothetical applications. Going into this process you need to first know how much power you intend to make and have an idea of how much boost you expect to run. The mechanical limitations of your engine and its displacement would be deciding factors in these estimates.
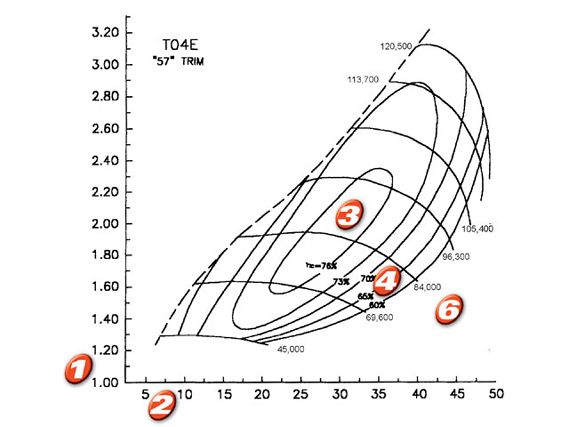
1)Pressure Ratio
The pressure ratio along the X-axis represents the boost you intend to run. The numeric pressure ratio value is calculated by taking the expected psi, adding one atmosphere (14.7) and dividing that number by one atmosphere (14.7).
2) Airflow
The Y-axis represents airflow in pounds per minute. As a general rule, each pound of air generated represents 10 hp. We are talking flywheel horsepower, so if you, like myself, think in "wheel time," make allowances for driveline losses. It is along this line where you estimate engine power output.
3) Efficiency Island
Not fantasy island, so be real here. This is the bull's-eye of efficiency. The center island is where the turbo is at its peak efficiency.
4) Wheel Efficiency
The outer rings of the graph represent reduced efficiency. The numbers and how much they drop off varies from compressor wheel to compressor wheel as does the corresponding loss of power potential.
5) Surge Limit
Any points plotted to the left of the Surge Line indicate the wheel in question is too big for the expected boost and power output. There would not be enough exhaust flow energy to spin the wheel fast enough to generate viable boost.
6) Overspin Choke
Any points plotted to the right of the graph mean the wheel in question is too small and will have to spin too quickly to make the expected boost/power. At these extreme wheel speeds, efficiency goes out the door because the wheel chops the air so badly that the pore density of the charge air will likely cause a dramatic loss of power.
7) Compressor Wheel Speed
This measurement, illustrated as lines across the graph, represents the shaft speed of the wheel. Remember, the faster it spins, the hotter the charge air. This is why they invented intercoolers
The missing pieces of the puzzle here are the engine's redline speed, the A/R of the turbine side and the volumetric efficiency of the engine. How fast an engine runs will impact the shaft speed of the turbo and when optimal efficiency is realized. The turbine side of the turbo will determine the spool-up characteristics and responsiveness of the unit. Turbine performance and engine redline speed are closely related, and together both of these factors will have a dramatic effect on the efficiency of the compressor wheel.
Further, an engine that has better volumetric efficiency, usually by way of cylinder head modification, will be able to flow more air and consequently require a different wheel than the same model of engine with no valvetrain tweaks. The compressor map is just an estimate that quickly indicates if the wheel in question will work based on two factors.
A map is not the end-all turbo-sizing tool. Turbonetics has a Turbo Match Spread-sheet program that takes into consideration the above listed items as well as fuel enrichment, intake temperatures and intercooler effectiveness to help pinpoint the proper compressor wheel for a given application.
 | How To Read A Compressor Map - Turbo Tech
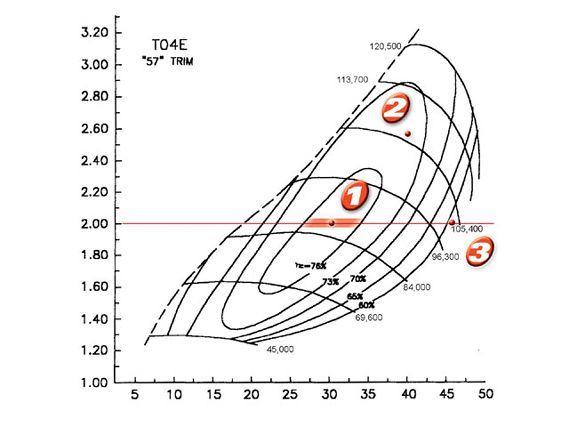
 Charting A T04E 57-trim Compressor WheelUsing a 15-psi max boost level the pressure ratio tallies 2.02. Plotting 2.00, we see peak efficiency will be realized when the wheel is moving 26 to 33 lb/min of airflow, which is capable of supporting 260 to 330 horsepower. If the engine in question is tuned to pump out 400 horses this T04E 57-trim wheel will need to see a rise in max boost to about 23 psi. Can the engine handle that kind of pressure? Does it have forged pistons and upgraded rods?
Even at this setting the efficiency is in the second ring. Also, look what happened to the wheel speed. It went from around 87,000 rpm to nearly 106,000. This will heat the charge air even more, working the intercooling system. While this wheel would get it done at 400 hp, a move to a bigger wheel may be better while also leaving some wiggle room for turning up the boost at a later date when the engine and/or the fuel system etc. are modified to handle the extra pressure.
Shaded Area
Peak efficiency for this compressor will be realized on an engine running 15 psi that is expected to generate 260 to 330 hp.
Dot-1
Here we see where 15 psi and 300 hp plots; right in the peak efficiency island.
Dot-2
With expectations of 23 psi and 400 hp, efficiency is bumped into the second ring. Wheel speed goes from 87,000 rpm at Dot 1 to more than 106,000 rpm here. Intercooling will be of prime importance. Can the engine handle 23 psi?
Dot-3
Expecting 15 psi and 450 hp, we see the combination plot outside the map in the overspin choke area. This compressor is way too small. A better flowing wheel or the move to a bigger housing/wheel combination is in order.