In the Sept. '09 issue, the "Dyno Dash-AWD" article illustrated the differences between dyno types, but what do you do with that baseline graph? How do you read the chart and decipher where there is power potential ready to be unleashed? How can the dyno be used to detect problems in the works that hinder power production? These are the golden questions of performance tuning. We have tracked down some dyno charts that tell interesting stories straight from the front lines. In Part 1, we'll get the ball rolling with a basic tech primer and then it's off to the charts.
 |
Tales From The Dyno Cell - Part 1
|
Tales From The Dyno Cell - Part 1
Anatomy Of A Power Curve
It's pretty common knowledge that the Y-axis of a power chart is home to the output numbers while the X-axis represents either engine speed or vehicle speed, depending how the dyno is set up. But there's more than power and torque being displayed on that printout.
Power Curve Crossover
Many people out there wonder why the power and torque curves crossover at 5150 rpm. It has to do with how the dyno calculates power. The dyno measures torque and uses that measurement to calculate power output. The formula to calculate horsepower is:(torque x rpm) / 5150. This is why torque and horsepower plots always intersect at 5150 rpm on a dyno chart.
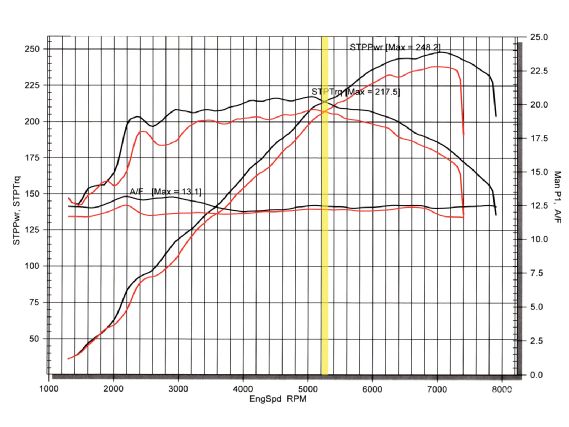 |
Yellow line: the power curve crossover on a dyno chart. It always intersects at 5150 rpm when horsepower and engine speed are displayed.
|
Yellow line: the power curve crossover on a dyno chart. It always intersects at 5150 rpm when horsepower and engine speed are displayed.
Smoothing Factors
Smoothing factors make the power curve more consistent and easier to compare before and after tuning changes. Smoothing consists of an averaging equation within the dyno's software that equalizes peaks and valleys in the readout. There is an impact on the final results as higher smoothing factors produce lower peak horsepower numbers. The key is to pick a setting and stick to it for all future comparisons.
Correction Factors
Ambient temperature, relative humidity and barometric pressure have a good deal of effect on engine performance. These mighty variables are whittled down and equalized using a correction factor that compensates for the environmental conditions, making the results equal and comparable.
 |
Tales From The Dyno Cell - Part 1
|
Tales From The Dyno Cell - Part 1
The most widely used correction factor is the SAE Standard J1349, which applies the following weather station data: atmospheric pressure 29.23, air temperature 77 degrees Fahrenheit and humidity zero percent. What are we talking about here?
To better understand how much variation is in play and how much misreading of power is at stake, consider the following facts. Atmospheric pressure is a by-product of altitude and the difference in power readouts between sea level and Denver, Colorado, is in the 20 percent range. A 30-degree jump in temperature from 60-90 degrees will produce about a 3 percent variance. Taking the SAE's zero percent humidity and turning it all the way up to 100 percent nets a 7 percent swing.
We decided to let the dyno act as detective to illustrate how dyno charts are read, interpreted and acted upon while providing some chart-reading lessons along the way. The following charts are from real shops, the events depicted are true and no names were changed to protect the innocent.
The Case Of The Maxed-Out Turbo
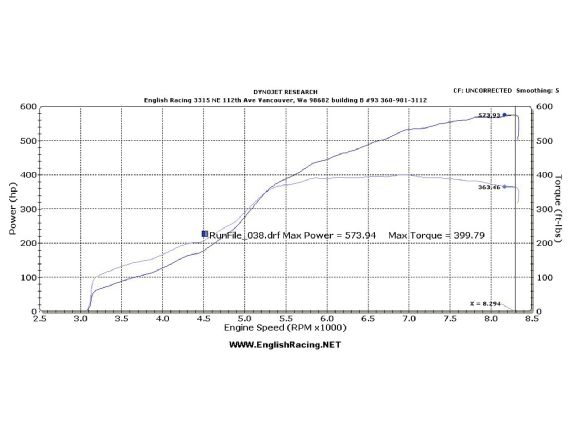
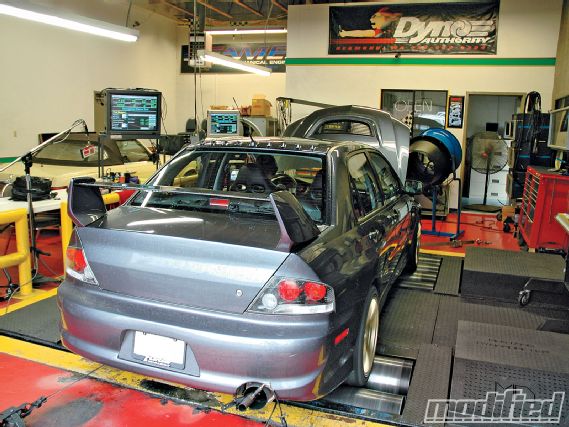
The car is a Mitsubishi Lancer Evolution owned by Aaron O'Neal of English Racing. It was used to develop the Camas, Washington-based company's E85 tuning menu. In this dyno chart [1], we are catching the car as it transitions away from its stock turbo that was pushing 31 psi and made 432 awhp on E85. Note the overall flatness of the power curve's shape and manner in which it tails off after 6000 rpm. This indicates the compressor is well off its efficiency island.
 |
|
The stock turbo system was swapped for an Extreme Turbo Systems (ETS) HTA3586 kit and was tuned on pump gas at 29 psi. Both systems used an Extreme Turbo Systems (ETS) 4-inch intercooler and piping, 1,000cc RC Engineering injectors, a Walbro 255 pump, Magnus intake and a bone-stock bottom end. The only mods to the long-block other than the turbo are the cams (GSC S2) and the valvesprings (Forced Performance Beehives). The stock turbo system ran a 3-inch exhaust, but it was upgraded to a 3.5-inch setup from ETS when the 3586 turbo was added. The 4G63 made 574 awhp, that's a 142-horse gain on less boost and on pump gas, not detonation-resistant E85. Too often the max boost number is given too much credence when it is the volume of air moving into the engine that makes more power. A larger turbo naturally flows more air. Further, turning up the boost too much on the stocker made the system inefficient, where the turbo was spinning so quickly it was chopping the air more than compressing it. This heats up the charge, and the hotter the charge, the less dense the charge and less dense means less power potential.
 |
Tales From The Dyno Cell - Part 1
|
Tales From The Dyno Cell - Part 1
The chart [1] also illustrates the compromise of going to a big turbo. Note the readings at 4000 rpm. The upgraded turbo produces a tad under 180 awhp while the more responsive stocker provided a touch over 280 awhp. Peak torque is nearly the same, but it comes on line much later with the 3586 setup. This is just the nature of the beast.
"When making such a large transition from the quick-spooling stock turbo to a high-horsepower, slower-spooling turbo you initially feel you made a bad choice," O'Neal says. "Driving the car on the highway and getting better mileage starts to get addictive. Spending some time with the car and learning its new habits, you realize that the lag is not that bad, it just requires an extra downshift that you might not have had to do before. All in all, the bigger turbo makes more power easier with less strain on the engine and is still easy to drive."
The Case Of The Burning Clutch
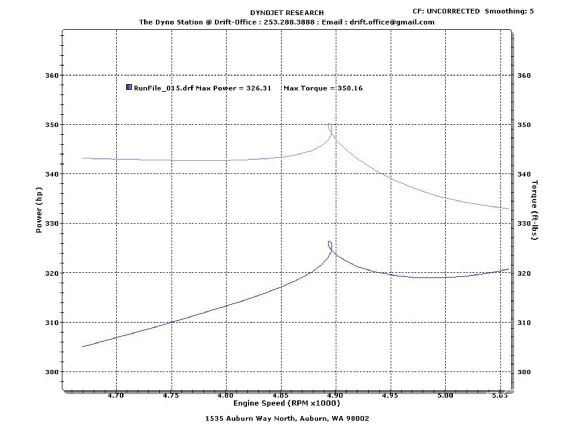
We often visualize, dyno chart [2] power curves as steep ramps on a rollercoaster. The steeper the ramp, with its chain-ticking climb to max power, the better the car's on-street acceleration. This is all well and good, but when your rollercoaster power plot pulls a loop-the-loop you're in the poop. The dreaded clutch slip loop burns both a hole in your clutch and a hole in your wallet at the same time. Drift-Office's Bob W. relates, "Big honking turbo, GT30 series, fantastic setup, stock clutch, terrible smell."
 |
|
The Case Of The Underachieving AFR
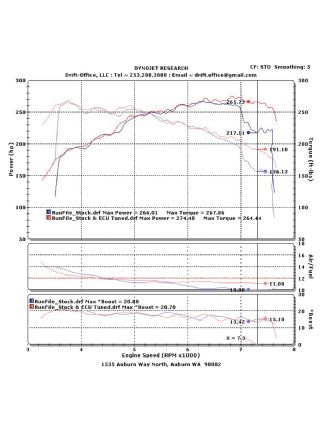
This chart [3] is from my own EVO, a '06 EVO IX SE, but it's pertinent to all EVO owners and many other cars where the factory tune is too conservative. The EVO is programmed to drop into oblivion at about 6200 rpm where the air/fuel ratio (AFR) plunges to 10:1, then, as shown it the separate lower graph, pretty much falls completely off the chart at 6800 rpm. The EVO's English Racing (ER) flash raised the AFR to well above 11:1. It should be noted that the EVO was bone stock at this point in time. The car baselined at 266 awhp and pumped out 274 awhp after the ER tune that used EcuFlash and EvoScan software and Tactrix hardware.
 |
|
There is a graph-reading lesson here-look past the peak. While an 8-awhp gain is nothing to sneeze at, the true impact of a proper AFR can be gleaned from 7000 rpm on up. At 7200 the 4G63 pumps out 48 more awhp, this with no mods whatsoever, just a flash!
Part 2 will feature charts that uncover clues that lead to culprits such as boost drop, ignition gremlins and rod knock to name a few as well as the effects of swapping cams. Stay tuned.