What we do to increase trail performance often decreases fuel economy on the street. With the help of Michelin, we undertook to study that situation from the tire's point of view, and see what effect tread pattern had on real-world fuel economy in a controlled situation.
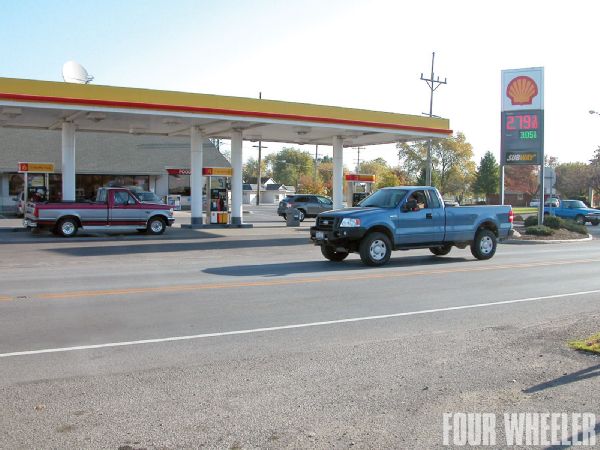 Our test was designed to show you the way to pass by a few more of these and add a little to your wheeling budget.
Rolling Resistance 101
It takes power to push your truck down the road against mechanical friction, wind resistance and tire rolling resistance. At low speeds, the tires and drivetrain are the primary resistance. Aerodynamics takes ever-increasing amounts of power at speeds above 50 mph. According to various studies done since the '70s, tires take 15 to 25 percent of the mpg bite at low speeds and 20 to 35 percent at freeway speeds. Gnarly off-road tires are known to take an even bigger chunk of power in all situations than street or all-terrain tires, but we could not find any specific testing done on them.
A big part of rolling resistance comes from hysteresis, a three-dollar word for the elastic properties of a tire that lets it conform to the road surface according to load, internal air pressure, and temperature. The more it conforms, the more power it takes to roll. Hysteresis is shown by how much more effort it takes to push a truck with the tires aired down than with them aired up. According to industry info, the tire tread typically accounts for 65 to 70 percent of total rolling resistance, the body 30 to 35 percent. Rolling resistance can be all but eliminated, such as by going to very stiff sidewalls, harder rubber compounds, or even solid tires and minimal tread (e.g., racing slicks), but hysteresis and tread design are what makes the tire deliver grip and traction. Tire design is always a compromise between traction qualities and rolling resistance, but technology, especially in the areas of tread compounds and body design, is bridging some of the gaps.
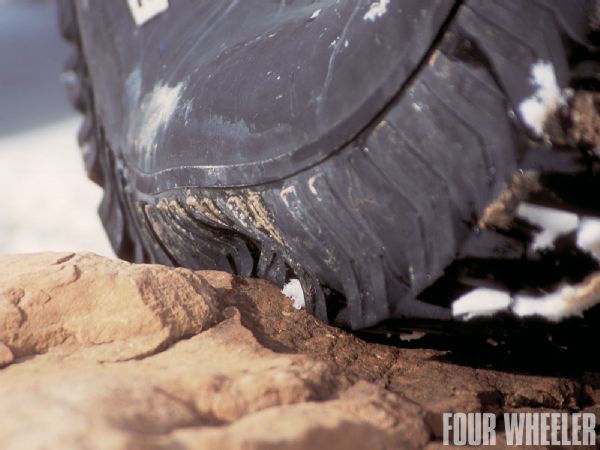 Hysteresis in action on the trail. Terrain conformation is just an exaggerated form of what happens on the street, but the less you have on the highway, the better your mpg.
You can find rolling resistance data listed two ways: In pounds of force (#F) and in a rolling resistance coefficient (RRC). RRC is best used to compare two tires of the same size. The #F is the raw force required to move the tire under a given load. Typically the RRC measurements are taken using two SAE protocols, one at a fixed 50mph speed and the other at varied speeds at a specified load.
Rolling resistance data for car tires is readily available but, thus far, testing on LT and flotation truck tires has been limited. The available material shows a big difference in rolling resistance between Light Truck (LT) and Passenger (P) rated tires. You can tell them apart by looking at the size in the specs or on the sidewall: P235/75R15 versus LT 235/75R15, for example. The differences are in the construction of the tires. LT tires are considerably heavier, but they need to be, and that's apparent when you compare load capacity. If load capacity matches your truck, a P-metric tire can be a slight to moderate mpg boon versus an LT. Bear in mind, however, that the LT tire is more durable, especially in a hauling or towing situation. For this reason, Federal Motor Vehicle Safety Standards prescribe reducing the sidewall load capacity by 10 percent when using P-metric tires on light trucks.
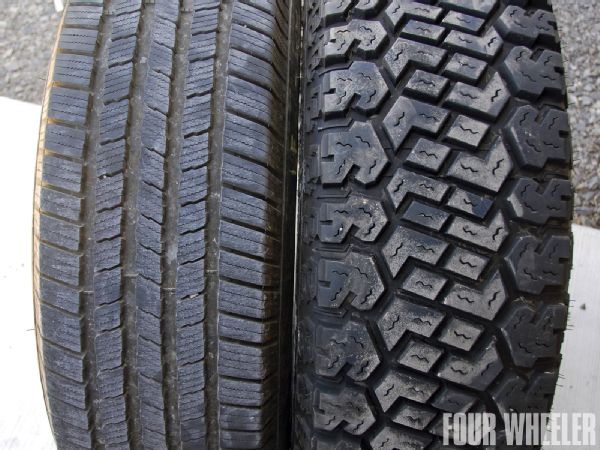 Which tread pattern delivers the best trail traction? Which tread pattern delivers the best street fuel economy and performance? In our test, the street tire delivered the best fuel economy by 15 percent.
Flotation tires, e.g., the sizes rated in inches (35x12.50R15), are a mix of characteristics. Some are LT-rated and some are not. In these cases, the Load Range C tires are generally closer to the P-Metric, and the D- and E-rated tires more like a LT. Some are actually marked "LT." We were not able to find a single rolling resistance test on flotation sizes.
Controlled Situation
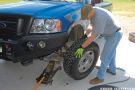
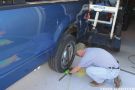
We started with a late model Ford F-150HD. It had recently been used to study fuel economy changes with various bolt-on engine mods, so we knew how to drive it consistently. We started with two sets of tires in the same size class, namely LT285/70R17 (33-inch equivalent), and mounted them on two sets of OE steel wheels.
With tire pressure an mpg consideration, we used a formula that converts the truck's original 245/70R17 factory pressures to the increased volume of the bigger tires. This formula can be used by anyone doing a tire upgrade, and you can see it in the nearby sidebar. In addition, we corrected tire pressures to a standard temperature and made sure we marked and reinstalled the tires in the same positions where they were broken in
We chose a 182-mile route of mixed city, country and freeway driving and picked a warm, temperature-stable day in which to run both sets of tires. It was within about nine degrees ambient temp at the end of each test, and the truck got a 6-mile warm-up before the start point of each test. We spot-checked to make sure the engine, trans and diff oils were warmed up to approximately the same point at the start of each test. In addition, gas from the same station and the same pump was used for fill-ups.
We preran the route and picked a weekday when the traffic would be consistent. During the drive, we studiously observed the speed limits, made full stops at all stop signs, and used the cruise control and the engine load feature on the Gryphon programmer to make our acceleration as consistent as possible.
PhotosView SlideshowThe Tires
First off, we want to make it clear that this was not a tire "shoot-out." The two tires we compared were from different companies and designed for different venues. Both were LT-rated but that's where the similarities end. One was a street-oriented all-season tire and the other an all-terrain on the aggressive side in that class. Apples and oranges-and we don't want you to interpret what we learned here as anything more than what it is: a comparison of tread patterns and their relative effects on fuel economy.
For our "aggressive" tread, we used Dick Cepek FC-II radials, a fairly new iteration of the Fun Country line. Our set had about 7,300 miles on them at the time of the tests, which gave them a bit of an advantage. Our all-season tires were Michelin LTX M/S2s with about 2,000 break-in miles on them.
Test Results
We were floored at the difference the tread patterns made. Our 182-mile loop delivered 14.929 mpg on the Cepek FC-IIs and 17.160 on the Michelin LTXs, a difference of 2.231 mpg, or 15 percent. We had been keeping our everyday mileage regularly with the Cepeks and we did the same with the Michelins, though over a shorter period, and the averaged results were 1.75 MPG apart. And the Cepeks were relatively mild trail tires. What would a set of really aggressive tires cost in mpg?
Bear in mind the divergent purposes of the two tires. The Michelins are street-biased all-season tires. The Cepeks are much more trail-oriented. Yeah, the Michelins delivered 2.231 mpg better on the highway, but take them into the goo and the Cepeks will leave them far behind. A street tire will also usually outlast a more aggressive tire. Yep, it's all about choices and compromise.
The point is not to diss one tire but to make you think about tire choices. The street tire would be the most fuel-efficient, with each step to a gnarlier tread costing just a little more. If you drive your rig every day, the questions become:
(a) How much time do you spend on the trail versus the street?
(b) How hardcore are your trips to the outback?
(c) Do you really need mudders day-to-day, or would A-Ts meet your needs? Or an A-S, like the Michelins?
(d) But, like John Wayne said in The Shootist, "When you needs six, load six." If "six" means mudders, there's the best choice.
If you drive 15,000 miles a year, the difference between 15 mpg and 17 mpg is $306 a year (assuming a stable $2.60/gallon price). At that rate, you could soon pay for a set of day-to-day street tires and then pocket the difference in a coupla years-and save your mudders for when you need 'em most.
Test Results & Parameters
Truck: 2005 Ford F-150, 8,200-lb GVWR, 4.10:1 ratios, 5.4L V-8, automatic
Fuel: Shell Regular, 87 octane, RVP- 9
Date of Tests: May 25, 2010
Trip Length, Miles: Dick Cepek, 180.3; Michelin, 181.9
Gallons Used: Cepek, 12.077; Michelin, 10.600
MPG: Cepek, 14.929; Michelin, 17.160
Average Ambient Temp: 88 (F)
Bigger Tires, New Pressure
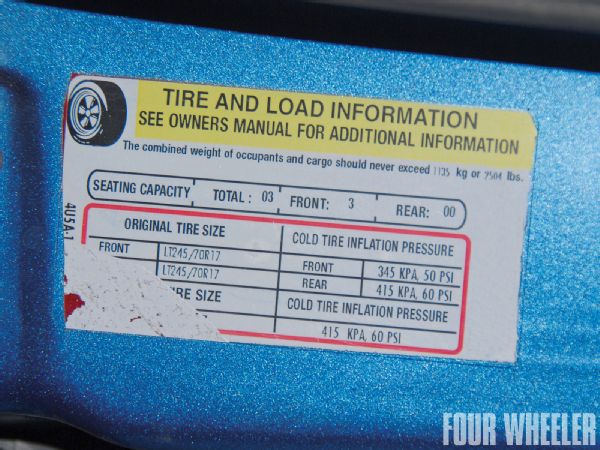
Once you install oversized tires, the OE-recommended pressures on the tire placard, or in the manual, are no longer valid because the internal volume of the tire has changed. Here's how you can translate those OE tire pressures to a new tire and give yourself a starting point. Increased volume usually requires less pressure to carry the same weight in the same class of tire because it isn't air pressure holding the tire up, it's air volume.
First, you need to find the Tire and Rim Association load inflation table (LIT) for the size and type of tire you are switching from, and to. If you Google "Load Inflation Tables," you will find many sources of such info. The tire manufacturers will also supply this information directly, and tire shops often have it.
Step 1: Look at the tire placard on your vehicle (or owner's manual) and write down the pressures listed for the stock tires. In our case, they were 50 psi front, 60 psi rear for LT245/70-17 tires, which will be our example. Those are the pressures listed for the truck to carry a rated capacity load, but yours lists both loaded and unloaded specs; either will translate.
Step 2: Look up the old tire on the load inflation table and note the weight each tire is rated to carry at the psi rating you want to translate, in our case 50 and 60 psi.
Step 3: The LIT is broken up into 5psi increments, and your recommended pressure may fall between. Yes, it matters. If that happens, you will want to determine how many pounds of weight that 1 psi will carry. Let's say your pressure is 47 psi and you are going to do the same tire swap we are. The weight rating at 45 psi is 2,010 pounds, and at 50 psi it's 2,205 pounds. Use the following formula:
2205-2010 lb. = 195 lb . = 39 lb. per psi 50 psi-45 psi 5 psi
Subtract 45 from 47 and you have 2 psi. Multiply 39 x 2 = 78. Add 78 pounds (2 psi worth of weight) to the 45psi load rating and you get 2,088 (2,010 + 78 = 2,088). That's the load the tire can take at 47 psi.
Step 4: Look up the new tire on the LIT. Find the pressure needed to hold up the same weight at the rated placard pressure. Our new LT285/70-17 tires can carry 2,105 pounds at 35 psi, so using the formula in Step 3, we know that to support 2,205 pounds, we need 38 psi. In back, our 60 psi load rating dropped to 44 psi with the larger tires.
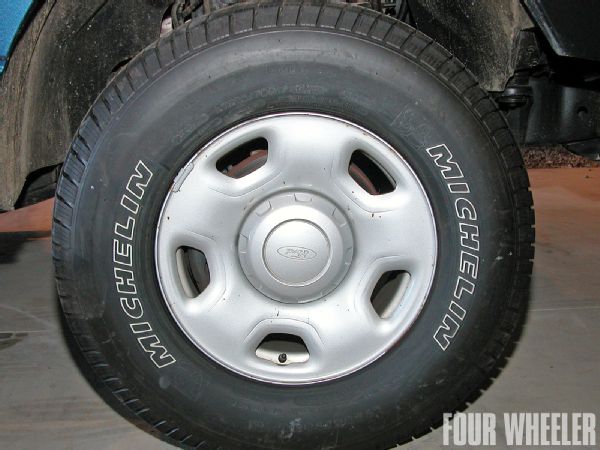
The Michelin LTX M/S2 is the latest iteration of the LTX M/S line introduced in late 2009. It's an all-season light truck tire that comes in both P-Metric and LT versions. Sizes cover the majority of light trucks and SUVs. LTs come in Load Ranges D and E and, commonly, with a 13.5/32 tread depth. The tread compound is high in silica, which makes it outstanding for use in rain. The tread design also lends itself to good snow and ice performance. The LT versions are part of Michelin's Green-X program, which is their commitment to improve fuel economy by updating their tire designs to be class leaders in the fuel economy department.
Size tested: 285/70R-17
Load range: D
Sidewall: 2-ply polyester
Tread: 2-ply polyester, 3-ply steel
Tread depth (in): 13.5/32
Tread width (in): 8.7
Section width (in): 11.5
Overall diameter (in): 32.8
Max load capacity (lb @ psi): 3,195 @ 65
Revolutions per mile: 635
Speed Rating: R (106 mph)
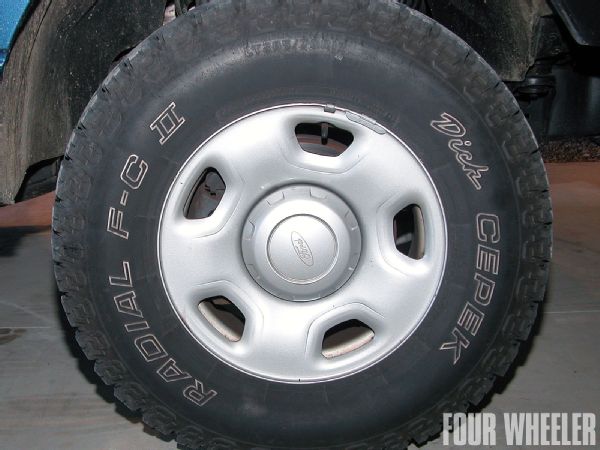
Dick Cepek's F-C II is an all-terrain light truck tire that debuted in 2008. It was designed to compete in that new aggressive A-T category, which some call the "missing link" between A-Ts and M-Ts. With 18/32 inch of tread depth, it's a little less gnarly than some deeper-tread mudders, but our trail tests showed them to be highly capable. They come in 36 size choices and in load ranges from C to E.
Size tested: 285/70R-17
Load range: D
Sidewall: 2-ply polyester
Tread: 3-ply polyester, 2 ply steel
Tread depth (in): 18/32
Tread width (in): 9.1
Section width (in): 11.4
Overall diameter (in): 32.8
Max load capacity (lb @ psi): 3,195 @ 65
Revolutions per mile: 617 (est.)
Speed Rating: Q (100 mph)
Choosing a Tire for Mileage