Our domes are on fire thanks to one seemingly simple idea we had for a great story. We wanted to go undercover at five different performance tuning facilities and test each of their chassis dynos using the same car in a short period of time. We hoped to uncover bogus numbers. We wanted to find the root of the problem for so many skeptical hot rodders who don't trust dynos as far as they can throw them. We were looking for a smoking gun or two. After hours of testing and days spent studying the data, we ended up with more questions than answers and decided we could write a book about the differences between dynos, test facilities, and data interpretation, and at the end of it all, we'd still arrive at the same conclusion: There is no smoking gun. The numbers just don't matter. That is unless you get off on having the biggest dyno graph on the Internet.
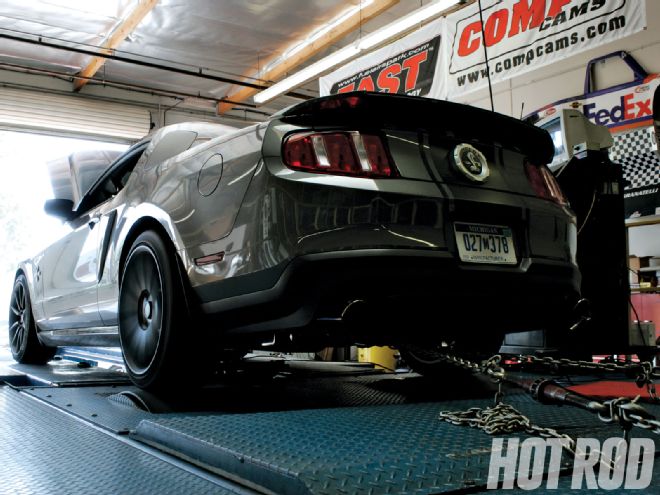 Granatelli Motorsports' Mustang dyno is as close to sea level as we could get. The company develops and produces speed parts for late-model hot rods and its large shop is well equipped for outfitting high-performance cars and trucks.
Repeatable results are the only ones that matter, and the only ones that can be used for A-B testing of performance gains or losses. Anything else is just hype, assumption, and fodder for ego stroking. When tuning for max power or verifying baseline performance, you need to be able to spot subtle trends. These trends are only valid if you stick with the same shop every time you want to verify a change to your car or engine. Oh, and one other thing: The numbers are no good if the shop alters its test protocol from one test to the next.
We borrowed an '11 Ford Mustang Shelby GT500 Super Snake, a 750hp demon of a car that costs around $90,000 and has enough rear-wheel power to break loose a set of 275/35ZR20s from a 50-mph roll. The Super Snake is Shelby's limited-production car that starts as a GT500 and gets a bigger Ford Racing supercharger, suspension bits, and other stuff to make 750 hp at the crank, and it comes with a warranty. Our test car had a six-speed stick transmission, as a manual is more repeatable on a chassis dyno than an automatic.
We hit five shops, one with a Mustang dyno, another with a Dynapack, two with Dynojets, and finally, one with a SuperFlow unit. We played dumb, showing up at each facility to have baseline dyno pulls made with a car our dad supposedly just bought. The Shelby wouldn't be tuned, "Dad" just wanted to know how powerful it was. Real data extrapolated from the car's performance at that shop, on that dyno, at that particular time is what we were after. Each shop took the bait and tested the car as they would for any regular customer. That's where it all went sideways.
How powerful is the Super Snake? We can't say for sure. If you believe the one-shot hero pulls that two shops gave us, then the Shelby makes more than 662 hp at the wheels. If you put more stock in the pulls that repeated more than once, then this is either a legit 630hp, 650hp, 600hp, or 577hp car. Follow our plight.
Dyno 1
Our first stop was Muscle Motors in Canoga Park, California, which works exclusively on Fords and had already tested several Super Snakes. We dropped $200 for four pulls on its Dynojet 224XLC. The Dynojet is an inertia-style dynamometer that measures the horsepower at the rear wheels and then uses a math formula to derive the torque. The horsepower is determined by the number of revolutions the tires spin the 3,000-pound dyno rollers during the time it takes to accelerate from 2,000 to 6,000 rpm.
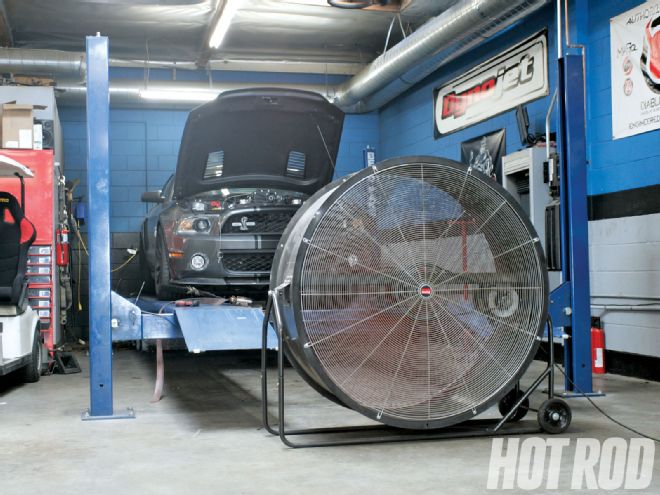
Muscle Motor's dyno area is located in the back of the shop, positioned to the rear of a drive-on hydraulic lift. Like most facilities, this one leaves the hood up and places a fan in front of the radiator and supercharger heat exchanger to keep the water and air inlet temps in check. The Dayton 2MV56 48-inch fan will move 21,200 cfm of air on its highest setting.
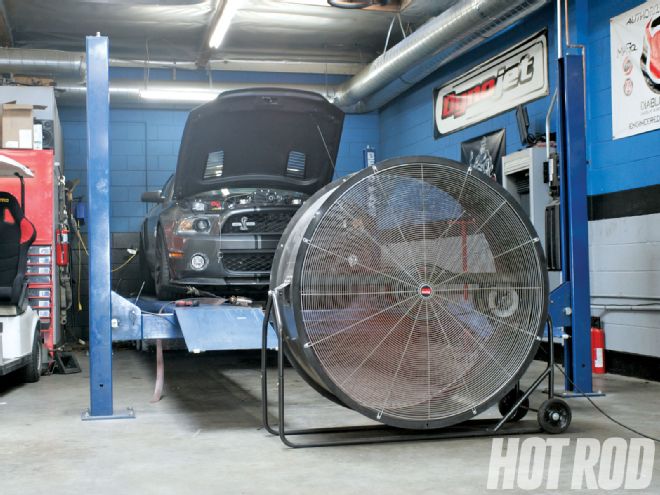 At Muscle Motors we wondered how well the overhead fan worked to keep the exhaust from polluting the air the all-aluminum 5.4L V8 breathed. It put up the second highest numbers of any dyno we tested.
Since the Super Snake was backed against a wall, an overhead fan built into the ceiling worked to flush out the exhaust fumes from inside the shop. After allowing the car to cool off for 20 minutes with the fan running, the tech made a full pull in Fourth gear. The peaks were 651.3 hp at 6,075 rpm and 611.1 lb-ft of torque at 4,914 rpm using the SAE STD correction factor. We snuck our Altronics PerformAIRE weather station into the shop to verify the weather information the dyno was using to make its computations and found the info to be solid. The dyno was applying a 1.02 percent correction factor to the raw figures to arrive at its final numbers.
After a 10-minute cooling session, the second pull at Muscle Motors shed light on a common problem with chassis dynos everywhere. The computer said the Super Snake put down 662.61 hp at 6,059 rpm, a gain of more than 10 peak horsepower with no changes to the car from the previous test. But, looking closely at the dyno graph, the peak horsepower figure came from a spike at the very end of the run right as the dyno operator ended the pull and pushed in the clutch. The spike was likely the result of tire slippage. With the exception of the spike, this pull mimicked the first one. The final pull backed up the first one with 611.59 lb-ft and 656.32 hp. Shop owner Jack Abraham offered a tuning session that would reportedly boost the car's output by 50 hp while improving driveability and throttle response. The cost-$1,000 plus the price of a handheld programmer. The Super Snake needs no help in any of those departments and we politely declined and headed to the next shop.
Dyno 2
Hours later, on Granatelli Motorsports' Mustang all-wheel-drive dyno in Oxnard, California, a location just a few hundred feet above sea level, the Super Snake put down 568 hp and 617 lb-ft of torque using the SAE J11349 correction factor. The first shop was located 790 feet above sea level, and this one was near the ocean. The dyno was using a 0.98 percent correction factor that actually reduced the raw numbers from 577.5 hp at 5,451 rpm and 626.9 lb-ft at 3,633 rpm. We were stumped as to why the Super Snake seemingly was down 87 hp (the equivalent of two air-cooled VW Beetle engines) and up 15 lb-ft of torque after travelling just 41.7 trouble-free miles from one shop to the next. More curious was that the Mustang dyno showed peak torque and horsepower occurring much earlier in the power curve than it had that same day at Muscle Motors.
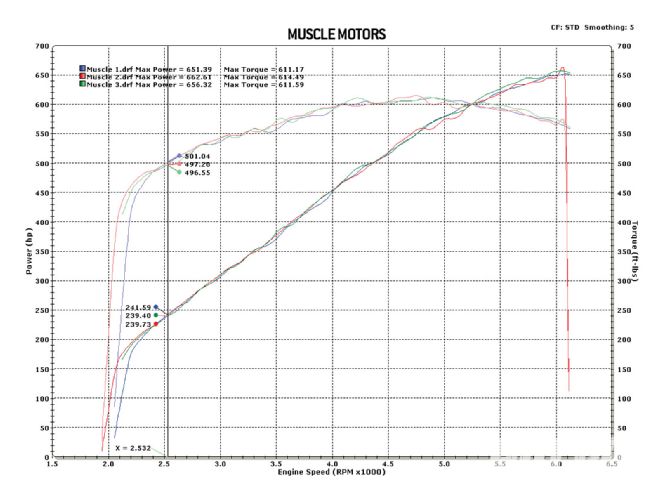 Shelby says the Super Snake makes 750 hp at the crank and Muscle Motors' dyno indicates a sub-100hp loss at the rear wheels.
We are fairly certain the tach signal was accurate, so that means the numbers were being skewed by another factor. After the test, we contacted the shop and the dyno manufacturer, eventually determining that a programming filter was inadvertently left on after the last calibration session and that was affecting the rpm readings. The Super Snake ran fine and we still have no idea why the horsepower numbers were down. The good news is that the Mustang dyno repeatedly said the car made 599 lb-ft of torque and 577 to 579 hp, so it was consistent, although different from every other dyno we tested.
Granatelli showed us another interesting thing: Simply by altering the dyno location's altitude from near sea level to 6,000 feet in the computer, the results climbed by 150 hp. It reveals that user methodology is critical and results are easily skewed.
Dyno 3
It was pure luck that our next appointment was at another shop with a Dynojet . We hoped this test session would back up the first one the day before. At Superior Automotive in Anaheim, California, we found a large shop filled with an engine dyno, a machine shop, and a bunch of high-performance muscle cars. The chassis dyno area was generous in size, with large bay doors at each end. Superior ran the car with the hood open and not one, but two fans facing the grille area.
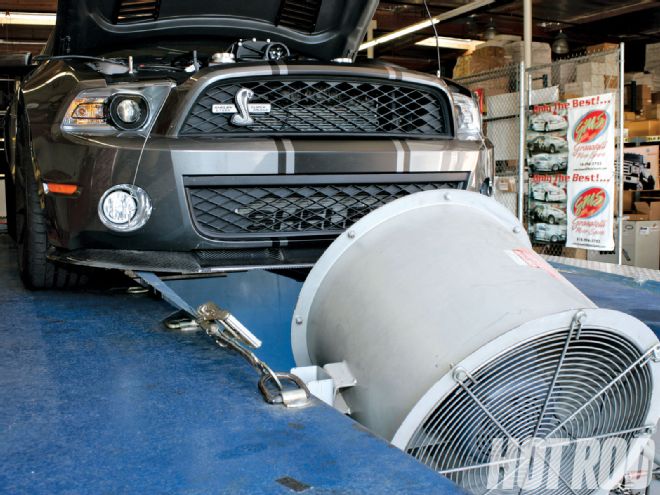 The Shelby didn't need that carbon-fiber splitter to direct air up to the heat exchanger and radiator when it was elevated on Granatelli's dyno. The fan got up close and personal for maximum effect.
The first pull was aborted at 4,500 rpm when either the clutch or the rear tires began slipping-we aren't sure which, but you could clearly see the problem in the Dynojet WinPEP 7 software, which showed the engine rpm climbing disproportionately from the drum speed. That was a wasted pull.
The shop made three more tests, which was considered a baseline dyno session with no tuning involved. The cost was $75, and had we only been interested in obtaining a peak number, it would have been a hell of a deal. But a problem reared its head when the Super Snake produced more power and torque on each successive test. Pull number two netted 564.40 lb-ft torque at 5,629 rpm and 638.77 hp at 6,070 rpm. After a seven-minute cooling session, the third pull generated even greater numbers, 585.3 lb-ft of torque at 5,368 rpm and 653.7 hp at 6,100 rpm. The Super Snake sat with the cooling fans blasting the radiator and heat exchanger for 12 more minutes before the fourth and final pull commenced, yielding 599.3 lb-ft of torque and 664.3 hp. The Snake was putting up bigger numbers every time a pull was made, but why?
The employee running the dyno said the car's computer was learning from each pull and that it was probably the first time the car had really been driven hard. But we had personally driven it very hard. It's a long shot, but perhaps it's because this dyno session required the shortest drive to get to, an 8-mile jaunt in bumper-to-bumper California traffic, which likely didn't give the rear differential, transmission, and engine oil enough time to adequately warm to operating temperature. Once at the shop, the car sat for almost an hour before testing commenced. The ambient temperature at this location was 10 degrees cooler than any other location we visited, and the car benefited from nearly twice the external cooling fan capacity as well, which certainly helped power production. Had we been running the test ourselves, we would have made several more pulls until we obtained repeatable numbers. As it was, the test was over and so we motored onto the next shop.
Dyno 4
EDO Performance Tuning is a Huntington Beach, California, shop that specializes in parts sales and installation for popular import cars like the Nissan 350Z, Subaru Impreza and WRX, and Mitsubishi EVO. We picked this shop because it has a Dynapack all-wheel-drive dyno, which bolts right to the axle hubs instead of using tire rollers to measure the acceleration rate. The dyno is located at the back of the shop with the exhaust pointing out the bay door and with three small fans facing the car's grille.
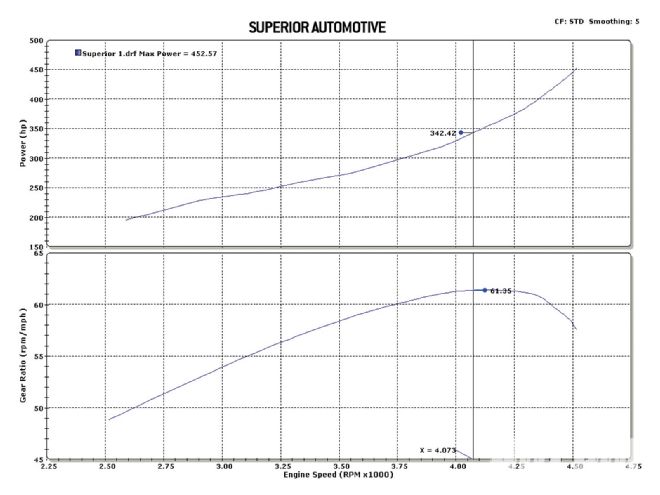 Whenever the engine speed (top) outpaces the drum (bottom) speed you can bet something is not right with your dyno test. The clutch or tires is the likely culprit.
We got four full pulls for $125 and paid an additional $20 to have an O2 sensor attached to one of the tailpipes to give us air/fuel data. The first pull was made within two hours of the last one at Superior Automotive. The shops are 10 miles apart. The Super Snake put up nearly identical torque numbers during all four pulls. The best was 569.4 lb-ft, and the rest were within 5 lb-ft. However, we saw radically different peak horsepower numbers as the data plots veered away from each other from 5,000 to 6,000 rpm. The first pull showed 602 at peak, while the second, which was made less than five minutes later, showed only 580 hp. The car sat for about 10 minutes before the third pull commenced and the Snake put up 598 hp, then a fourth run showed a dramatic drop to 561 hp.
So, how powerful is the car? Does it make 598 to 602 hp at the wheels or 561 to 580? Was the problem that the blower was heating up? This test session was not conclusive.
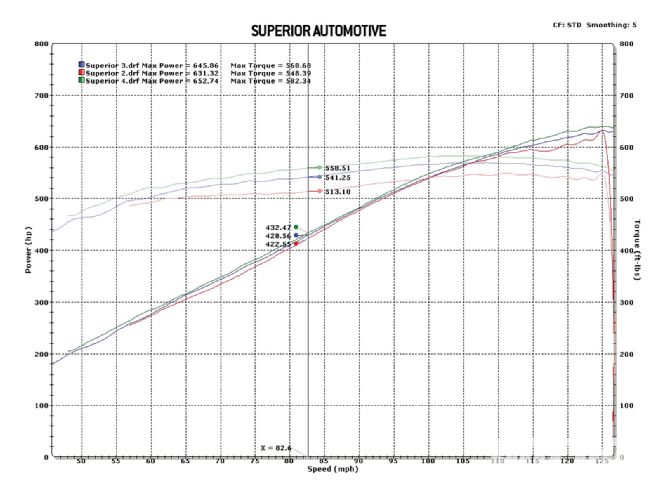 When the lines on the graph are spread that far apart without any tuning changes between pulls, you have to start asking why.
Dyno 5
Our last stop was to a familiar shop, Westech Performance Group in Mira Loma, California. The guys there obviously knew Dad didn't buy the car, but we did not reveal exactly what we were doing. We wanted to add another dyno brand to the mix, and that was a SuperFlow AutoDyn 30 that can operate in inertia or eddy-current mode. The room is large, with the dyno built into the floor at the front of the shop. The car sat on the rollers with the exhaust directed outside and a large Dayton fan in front of the open hood. Westech prefers to "hot lap" the car on the dyno, making several runs within minutes of each other to simulate on-road performance.
The first pulled showed 624.4 hp at 5,944 rpm and 622.7 lb-ft of torque at 4,381 rpm using the SAE STD correction factor. The second and third pulls were right at 632 hp and 608 lb-ft, and since they repeated, the operator let the car sit twice as long before making another backup pull. That next pull showed the car picking up power, peaking at 638 hp and 641 lb-ft of torque. Since that was a new high, the operator immediately made another pull and heat soak knocked the power down, resulting in just 624 hp and 608 lb-ft of torque again. Satisfied with the numbers, that's where the test session ended and we were handed a bill for $175.
The Super Snake put up six runs that were all within 14 peak horsepower of each other, and twice it repeated the peak number and average power numbers. This is good, usable data. Ignore the hero pull and focus on the others and there's only a 7hp difference among the other five.
So How Do You Get Repeatable Results?
Every brand of dyno in this story can provide consistent test data. If you see big variances from pull to pull, you need to look for answers in one of three areas.
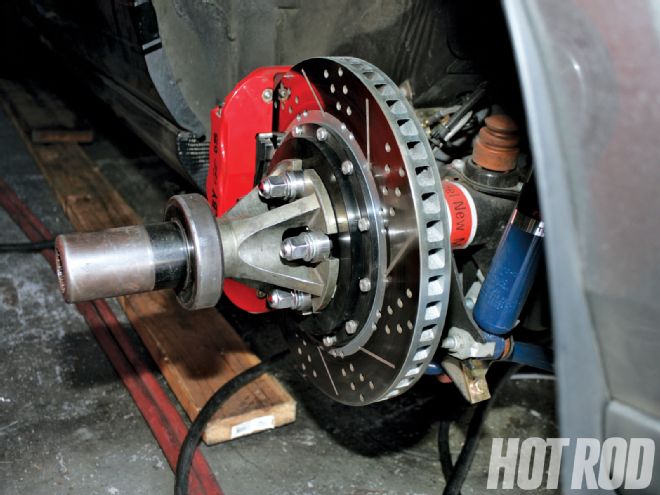 The Dynapack adapters bolt on to the hubs using the OE lug nuts, and the splined couplers slide right into the machine. The dyno then puts a hydraulic load on each adapter, and unlike on an inertia dyno, there are no rollers or tires involved, so there's no slippage to account for.
First, seek mechanical problems in the test procedure. For example, low tire pressure can affect chassis dyno results and must be consistent from test to test. The same is true for how tightly the car is ratchet-strapped to the rollers. If a shop tests with the hood open on one pull and closed on another, that can change output, as can being inconsistent with the cooling fan or the oil and water temps. Cars with automatic transmissions have a torque converter that is not a fixed coupling to the wheels, and especially in the case of drag race converters, they can lead to wonky results-even more so if the operator does not "drive" the car the same way each time.
Second, there could be input-data inconsistencies. Make sure the same data is in use every time you visit the dyno. Look for oddly out-of-range weather correction factors; they typically fall between 0.9 and 1.09. Also ask what weather correction factor is being used, as it varies from shop to shop. Some dynos plot the power numbers versus mph rather than rpm, but those with the preferred rpm curves need some way of reading engine speed. This could be through math (tire diameter versus gear ratios-very difficult with an auto trans) or more likely through direct reading from the engine. The rpm could be read from a tach lead, a plug-wire inductive pickup, CAN output, or a strobe on the harmonic damper. Make sure the method is the same each time. Don't forget that torque and horsepower always cross at 5,252 rpm. If they don't, raise a red flag.
Finally, there can be mechanical problems with the car. To keep better tabs on this, many shops will supply data about air/fuel ratios, and you'd like to have that at the least. Big variances in air/fuel can change power (and hurt engines), as can air inlet temp. With the Roots-blown Super Snake, inlet temp changes in both directions likely led to many of the pull-to-pull inconsistencies we saw, but only one of the shops provided that data; they might have been able to had we asked. In the end, you don't care what the numbers say as long as you can get consistent results from test to test. Without that, you never know which way is up.
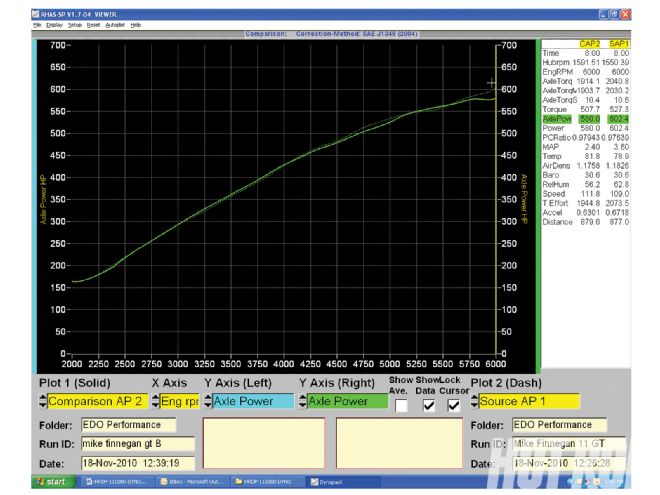 At EOO, the Super Snake made nearly identical peak torque numbers down low, but the horsepower figures up top were a different story, with a 22hp variance between two pulls.
Correcting the Correction Factor Confusion
Every shop we visited provided dyno data that showed horsepower and torque numbers altered with a weather correction factor. The raw power figures are multiplied by the correction factor, giving us the ability to adequately compare engines tested in varied conditions of temperature, pressure, and humidity. Because engines make more power at oxygen-rich sea level locations than they do atop the Rocky Mountains, or in dry and cool climates as opposed to hot and humid ones, it's necessary to have a formula that takes into account these conditions to level the playing field between different dynos, or even different test days on the same dyno. The Society of Automotive Engineers developed several correction factors for dyno testing, and it's important that if you compare numbers from one dyno with the next that the factor be the same. Two of the dynos we tested used the SAE J1349 correction factor, which utilizes the following numbers for reference: 77 degrees Fahrenheit, 29.234 in-Hg barometric pressure, and zero percent humidity. The other three dynos used the SAE STD factor, which references 60 degrees Fahrenheit, 29.92 in-Hg, and zero percent humidity. Using the STD factor usually pushes the raw power numbers approximately 4 percent higher than the J1349. Keep in mind that weather correction factors do not change the rpm points at peak power.
LOCATION DYNO TEMP BAROMETER HUMIDITY CORRECTION FACTOR EDO Performance Dynapack 73°F 30.6Hg 30.3% 1.015% SAE J1349 Granatelli Motorsports Mustang 71.6°F 29.8Hg 45% 0.98% SAE J1349 Muscle Motors Dynojet 72.0°F 29.2Hg 25% 1.02% SAE STD Superior Automotive Dynojet 63.0°F 30.0Hg 53% 0.99% SAE STD Westech Performance Group SuperFlow 76.5°F 28.9HG 36.5% 1.06% SAE STD
Types of chassis dynos
Dynos can be categorized as either inertia, hydraulic, or electric. An inertia dyno can only do full-throttle acceleration runs, but the best load-bearing hydraulic and electric dynos can do step tests, constant-speed pulls, and even part-throttle testing so that full road-load simulations can be conducted right on the dyno.
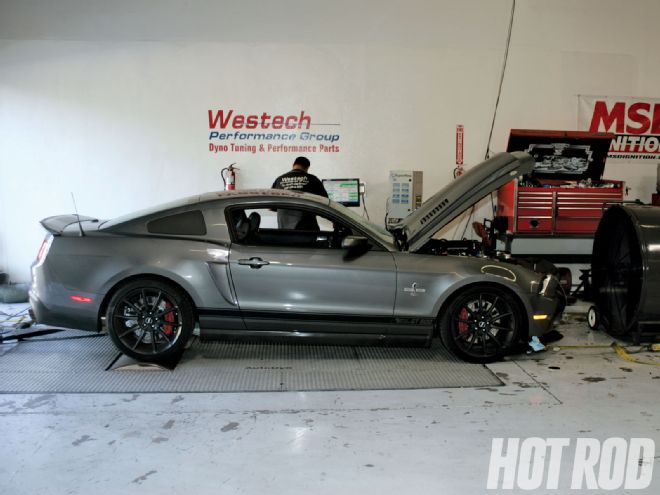 Westech Performance offered the only dyno built into the surface of its shop, a SuperFlow unit.
Inertia Dyno: These extrapolate rear-wheel power output by analyzing the dyno drum's acceleration rate using a sophisticated accelerometer and computer software. A vehicle is placed on the dyno with its drive wheels sitting on heavy roller drums of known mass. The car is placed in gear and accelerated at wide-open throttle. It takes a certain amount of time and force for the tires to accelerate the rollers. The acceleration rate is directly proportional to how much power the tires place on the heavy roller to get it to rotate. Inertia dynos have the reputation for reading "high." Generally, with mainstream vehicles in the 3,500-pound class, they'll yield consistent results with minimal setup time. They may have trouble obtaining accurate results with extremely heavy or light vehicles. Turbocharged engines won't build boost as they do in the real world. Dynojet is the most common pure-inertia dyno (some of its newest models have an eddy-current option).
Hydraulic Dyno: Like most engine dynos, the hydraulic or water-brake chassis dyno relies on a constant speed brake or absorber coupled with a rotor with a rotating element and a stationary element. On most hydraulic chassis dynos, the tires turn rollers that in turn couple with the rotor. An exception is the Dynapack, where the load brake attaches directly to the axle, removing the tires and rollers from the equation. Either way, the rotor elements generate braking force using water or hydraulic fluid to absorb or match the powertrain output. Usually a strain gauge measures the torque reaction between the rotor's rotating element and a stationary element. Again, Dynapack is unique: Instead of a strain gauge, it measures the hydraulic fluid power required to hold a vehicle at a constant rpm. Potential hydraulic dyno problems are impeller lag when you snap open the throttle and the need for periodic recalibration.
Electric or Eddy-Current Dyno: This type of dyno controls the brake/absorber using electric current instead of fluid, measuring torque output and calculating power based on a strain gauge. Electric current provides much more precise control and minimal spool-up lag time, but you need a gonzo electric supply and the dyno itself is more expensive than other types. Electric dynos are best for sophisticated R&D, emissions testing, and calibrating electronic engine management systems under heavy vehicle loads, but achieving their full potential requires a high degree of skill and setup time. Mustang and SuperFlow are among those marketing high-end, eddy-current dynos. Some electric dynos can also be run in full-inertia mode, but then they have the same drawbacks as any other pure-inertia dyno. -Marlan Davis