
Editor's Note: What if there were technologies and approaches to running a race car that significantly increased performance, were relatively inexpensive, lowered operational costs, supported domestic industries, and virtually removed racers from the environmental debate? Even though many racers may not be particularly concerned about their potential environmental impact, the performance and cost benefits can be significant. Racers spend countless hours and resources trying to gain the slightest bit of performance advantage. It's this passion that makes the people involved a truly special group of individuals.
Circle Track's "Project G.R.E.E.N." team is on a path to demonstrate that our goals are not unrealistic and now appear to be within our reach. From the results contained in this story, we believe there are virtually no significant compromises in using electronic fuel-injection (EFI) in an oval track car since increased performance and lower operational costs are achievable. In addition, racers could be seen as leaders in the overall environmental movement.
Beginning with the Jan. '10 issue of Circle Track and in subsequent stories and interviews, we have collected a range of opinions from various stakeholders both inside and outside the motorsports community. The mounting body of evidence in support of our concept continues to grow and promises to offer a viable and cost-saving alternative to contemporary ways of going racing.
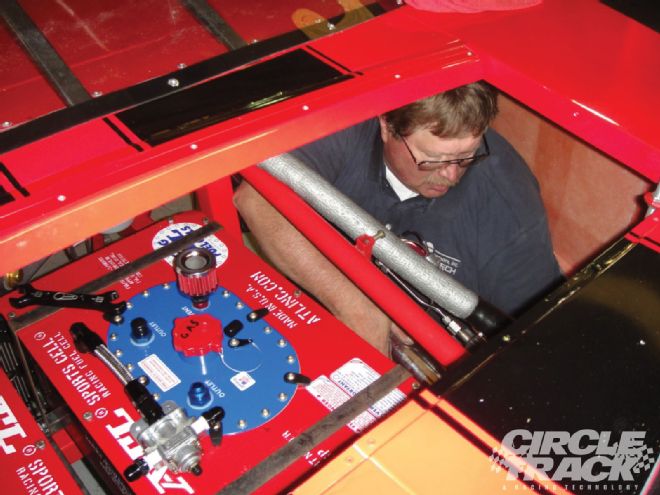 Dave Kalen from Sensors, Inc., installs the heated exhaust flow-meter and exhaust sample line to the SEMTECH DS portable emissions measurement device. Also note one of two fuel cells used; the passenger-side for race fuel (shown), the driver-side E85.
So, in order to further demonstrate an increased credibility for the technologies we're advocating, the team felt there was only one way to pursue that: prove them at the track. So, we packed our bags, equipment, and stopwatches, survived a couple of lightning strikes, a long week in the shop, and the blistering and humid summer trackside sun in Daytona, Florida, with long hours of wrenching and tuning to validate the concept. We openly share our on-track results in the following discussion with the anticipation you will be pleasantly surprised.
Testing Format
One cornerstone for this project has been the unique ability to accurately measure real-time emissions. This was demonstrated in the dynamometer testing article published in the May '10 issue of CT.
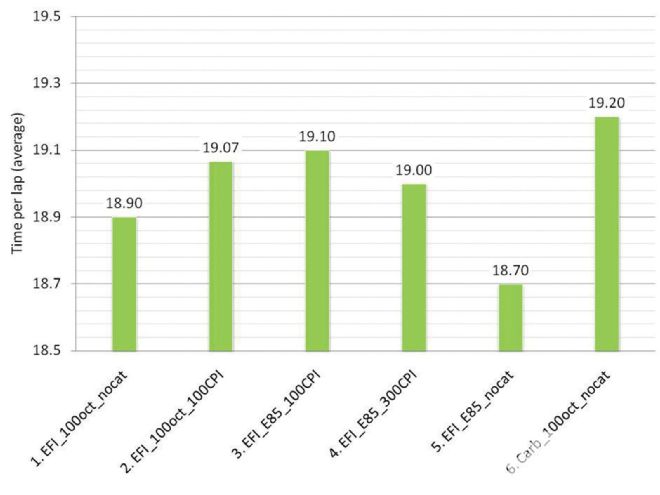 <strong>Graph 1:</strong> New Smyrna raceway, half-mile oval. Average time per lap, in seconds, for each configuration.
Capitalizing on the capability of this tremendous technology, the Project G.R.E.E.N team installed a Sensors, Inc. SEMTECH DS portable emissions measurement system (PEMS) in a tube frame race car. Traditionally, accurate emissions testing required vehicles to be tested in a laboratory environment. However, this unit allows real-time emission measurements with the vehicle operating at the track, as it would in a race. By linking a GPS and a data acquisition system that allowed for temperature measurements and engine control unit (ECU) codes, the team tested each configuration twice over a series of five-lap runs (for a total of 10), running virtually-identical lap profiles.
Cones were set up on the track for the driver, Dalton Zehr, to reference braking and acceleration points. In addition, he drove very similar track lines to maintain consistency. Testing required using the same engine as in the engine dyno tests, GM Performance Parts' CT525. The only changes involved swapping the fuel induction system (carburetor to fuel-injection), switching between fuels (race fuel, E85), and installing catalytic converters, all of which had previously been done during dyno testing.
 Argonne National Laboratory Research Engineers Danny Bocci (left) and Forrest Jehlik (right) with Circle Track Editor, Rob Fisher, in the background. On-board is the Sensors, Inc. SEMTECH DS portable emissions measurement system (PEMS). This system allows for modal measurement of criteria emissions (NOx, CO, HC), CO2 and fuel consumption, and pertinent environmental conditions (temperature, pressure, humidity). In addition, the unit has an analog data channel and CAN communication inputs, as well as GPS capability.
In order to facilitate quick changes and ensure the fuels tested were not inadvertently mixed, the Project G.R.E.E.N. Camaro was equipped with two fuel cells; one for race fuel and the other for E85. This ensured fuel homogeneity and consistency. Quick connections were placed in the exhaust pipes to simplify catalyst swap-out, and changes between manifolds for carburetion and fuel injection took no more than 20 minutes. From there, it was simply a matter of running the laps, measuring and analyzing the data, and openly sharing the results with you, our readers.
Performance Results
Once all laps were run, the team analyzed the data to determine both the performance and emissions benefits. Graph 1 shows the average time per lap. Upon examination, you'll see that the slowest average lap-time was recorded using the industry standard carbureted, race gas configuration. Over the half-mile oval, the average lap time was 19.2 seconds. The fastest average lap-time was recorded using E85 and EFI without catalytic converters, at 0.5-second quicker per lap. Even with converters bolted on, the E85 EFI configuration's average lap time was reduced 0.2-second, relative to the race-fueled and carbureted counterpart using no catalysts.
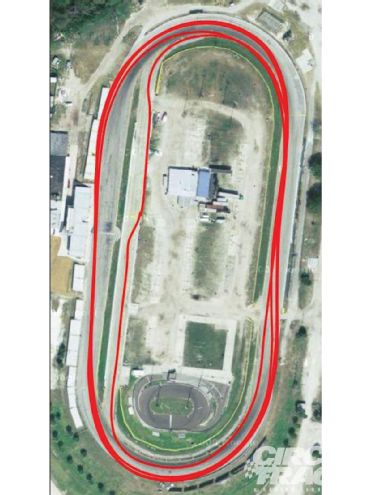 Aerial view of New Smyrna raceway. The red lines indicate the recorded position of the car over five laps. Two warm-up laps, five laps of maximum-effort (tracing same path), and one coast-down lap before re-entering pit lane.
Referencing the May '10 issue of CT, dynamometer testing revealed that the E85-powered, EFI configuration generated approximately 7 percent greater torque across most of the engine speed range. Even with catalysts, the E85-powered, EFI version still showed greater torque benefits. At the time (given specific rpm ranges where torque was improved), it was projected that the greater torque would allow for quicker corner-exit acceleration, resulting in lower lap times. Coupled with proper gearing, the team felt that even further lap time improvements could be achieved.
If you compare the torque curves generated during engine dyno testing (see Graph 2) to the reduced average lap time shown, the results are conclusive. Quicker lap times were observed for all EFI configurations, with the greatest improvement coming from the E85/EFI configuration. Even with the use of catalytic converters, average lap-times were reduced from the carbureted, race fuel, non-catalytic converter baseline tests.
As mentioned earlier, one of our objectives was to produce the most consistent laps possible to make certain all data gathered shared common test conditions. The times shown were recorded with the on-board emissions measurement equipment (which added nearly 100 pounds to the Camaro while increasing its center of gravity height).
<strong>Graph 2:</strong> Engine dynamometer, full-load testing results at Mast Motorsports, November 2009. Results were published and discussed in the May '10 issue of Circle Track.
At the conclusion of on-board emissions testing, the equipment was removed, and the team conducted a series of maximum effort qualifying laps with the EFI/E85 combination for comparison with the carbureted/race fuel configuration. Lap times for the E85/EFI package were recorded at 18.20 seconds. By comparison, the carbureted configuration was again 0.5-second per lap slower, an improvement of more than 2 seconds over our five-lap run.
Several factors played a role supporting improved performance. Among them was an increase in air/fuel charge density based on the superior vaporization characteristics of ethanol. Another was the more favorable burn curve characteristics of ethanol. In addition were the benefits of individual cylinder fuel metering derived from EFI, combined with improved cylinder-to-cylinder air/fuel charge distribution and balancing. It was the integration of these factors that netted the overall gains. In addition, the wide-range O2 sensing that we used allowed for overall fueling rate correction with EFI, thereby closely maintaining ideal peak power A/F ratios. Recording real-time exhaust emissions enabled us to analyze the transient A/F ratio response of the car (on the track) and coincidentally analyze the excursion (transient period or spike as shown in Graph 3).
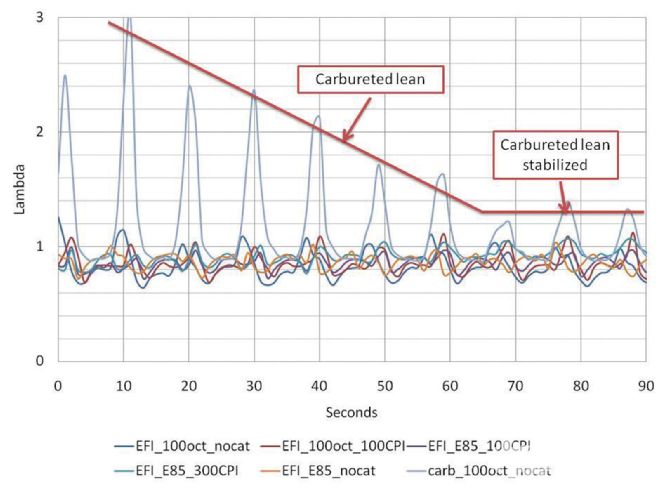 <strong>Graph 3:</strong> Relative A/F ratio measured for five laps and shown in Lambda units. Lambda is the ratio of the actual A/F ratio divided by the stoichiometric A/F ratio. Lambda values less than 1 indicate "rich" ratios while values greater than 1 depict "lean" values.
Comparing the various A/F ratio excursions, you can see that the carbureted/race fuel configuration shows significantly leaner spikes of duration longer than for the EFI system. Past the venturi, the metered fuel flow to each intake runner is a complex non-ideal flow pattern. Compared to intake air, fuel droplets exhibit greater momentum and have greater difficultly navigating bends and curves of the intake manifold and its runner. This mechanical separation of air and fuel results in a portion of the fuel wetting the intake manifold floor and walls. This fuel pooling or impingement inside and against the manifold results in transient delays getting air/fuel charges into the cylinders. In combination with unequal cylinder-to-cylinder air distribution (based on manifold design) this contributes to poor charge distribution among the cylinders. These effects result in the variations measured and contributed to the reduction in performance of the carbureted package.
Also, the severity and earlier occurrence of the lean transient spikes decreases during lap accumulation as you can see in Graph 3. However, the carbureted spikes still remained significantly higher than those of their EFI counterpart. This is most likely due to the intake manifold becoming warmer, resulting in a larger fraction of the intake manifold fuel film being vaporized and delivered to the cylinders. When the manifold was cooler, less fuel vaporized and the spikes were less pronounced.
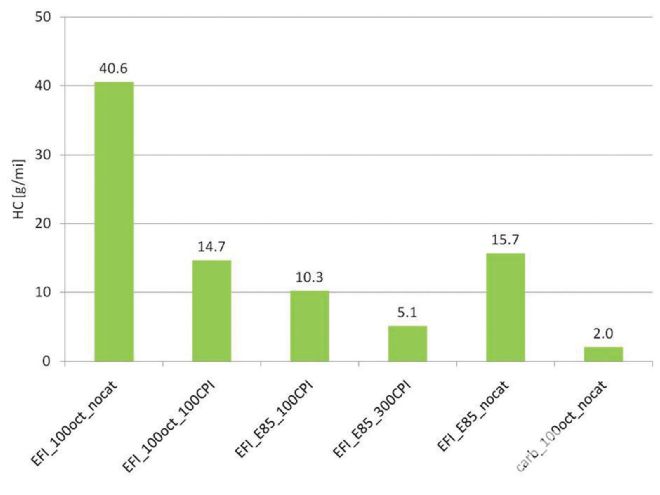 <strong>Graph 4:</strong> HC emissions based on a five-lap average for each engine/fuel configuration. Units are normalized in grams per mile traveled.
Emissions Results
The other piece of the puzzle was to assemble so-called "engine out" (pre-catalytic converter) emissions and the effectiveness of utilizing two different versions of catalytic converter configurations on regulated emissions (unburned fuel [hydrocarbons, HC], carbon monoxide [CO], and oxides of nitrogen [NOx]). Graphs 4-6 display five-lap averaged emissions for each powertrain configuration for data comparisons. The units shown are in grams of emission per mile traveled, the standard units of measure. This data was collected at the same time the performance data were measured.
By reviewing these figures, you will find there is a significant reduction using the EFI/catalyst combination relative to the combination without catalysts. For the 100 cell-per-inch (cpi) catalyst, there is a 75 percent reduction in HC. For the 300 cpi unit, it was 87 percent. Interestingly, the HC emissions for the carbureted version without catalysts were lower than for all of the catalytic converter configurations (Graph 4). This seems counter intuitive. However, if you refer to Graph 3, these results become much clearer.
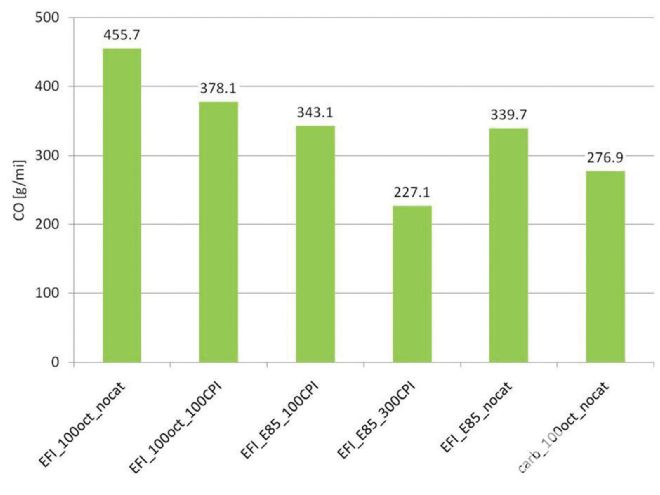 <strong>Graph 5:</strong> CO emissions based on a five-lap average for each engine/fuel configuration. Units are normalized in grams per mile traveled.
Since the carburetor exhibited large lean spikes, there was very little fuel to burn. HC and CO emissions always run inversely to NOx emissions with regards to relative A/F ratios-e.g. fuel-lean conditions create low HC/CO and high NOx, while fuel-rich conditions generate high HC/CO and low NOx.
By comparing the CO and NOx data shown in their respective graphs (5 and 6), you'll see this to be the case. The inherently lean A/F excursions recorded with the carburetor (which contributed to the reduced performance) generated less HC and CO emissions but generated more than five times the NOx emissions compared to the catalytic converter fuel-injected configuration (Graph 6). Therefore, a comparison of catalytic converter effectiveness could not be conducted relative to the carburetor. However, by focusing on identical engine and fuel configurations, this comparison was made.
When comparing identical configurations and the emission reduction potential without the relative A/F ratio variations produced by the carbureted version, the picture becomes much clearer. Removing the carburetor results and focusing on identical Lambda values and measured emissions, the effectiveness of the catalytic converter becomes clear. Graph 7 summarizes the emission reduction, using both the 100- and 300-cpi catalysts, relative to the same configurations with no catalysts.
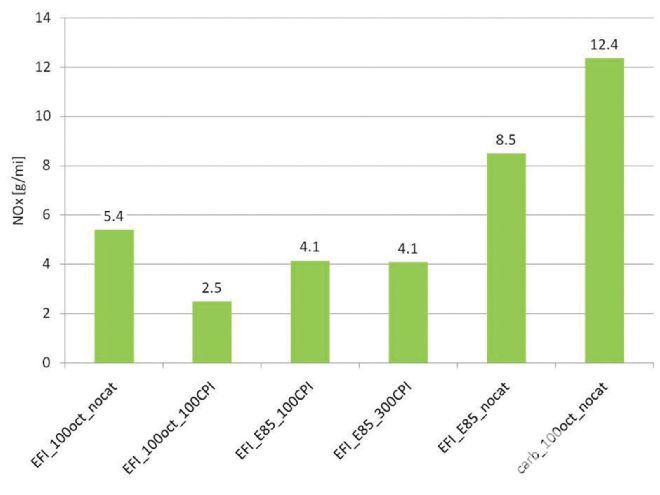 <strong>Graph 6:</strong> NOx emissions based on a five-lap average for each engine/fuel configuration. Units are normalized in grams per mile traveled.
From these results, it appears that a modest CO reduction was produced by all of the catalytic converter configurations. However, significant HC and NOx reductions were produced. The 300-cpi catalyst produced notably greater HC and CO reduction, even though NOx conversion remained almost the same among the parts combinations. You can also see that the conversion efficiency between the Street Blaze, 100-cpi configuration is higher than the E85 version.
A plausible explanation for this deviation is based on the design of the catalyst. Catalytic coatings are selected and tailored for specific fuels. Specifically, almost all converters sold are intended to be used with petroleum-based fuels. If we were to focus specifically on the emissions from an E85-fueled engine, converter cell count and formulation of the catalyst could be altered to address this specific fuel. As an example, since the relative fuel flow rates are on the order of 25 percent higher for E85 than race fuel (based on lower energy density or content), it is plausible that the length and size of the catalyst may need to be increased to address the relatively low A/F ratio, thus ensuring enough catalytic reaction surface to reduce the emissions.
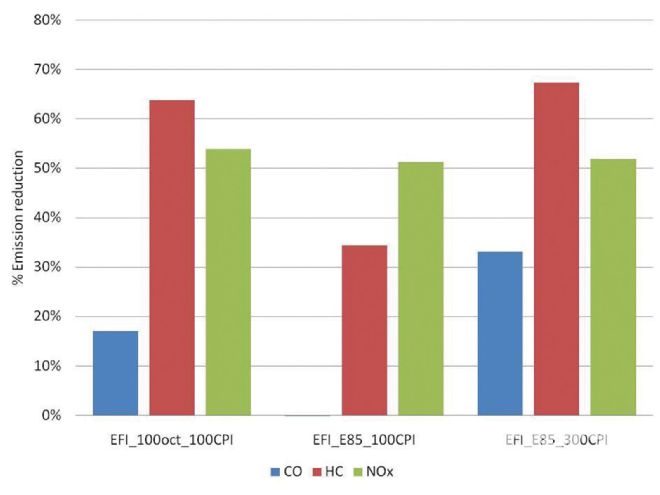 <strong>Graph 7:</strong> Catalytic converter emissions reduction efficiencies comparing 100 cpi vs. 300 cpi (E85) with Street Blaze vs. E85 (100 cpi) EFI configurations.
Some Preliminary Conclusions
We use the term "preliminary" for several reasons. In particular, there are additional tests to be conducted. The Circle Track team has an implicit responsibility to conduct this project not only with a strong desire to report accurate findings but also do so using all available engineering skills and data reduction practices available to us. But even at this stage, there are some issues of significance. We'll mention only a couple of them.
For example, during the initial track tests, almost a full day was required to calibrate the carburetor, in order to optimize its performance and begin gathering meaningful lap data. Horace Mast (Mast Motorsports) tuned the EFI system in less than 20 minutes, once an initial few laps were logged with this combination. While we didn't attempt to quantify how this would impact the economics of long-term EFI use on fuel and tire costs, they would certainly be reduced. Also, as predicted from the engine dyno test session, based on improved brake torque below 5,500 rpm, corner exit acceleration and lap-time reduction proved out on the track.

In face of all this, it's worth repeating that along the path we've been taking, optimization steps have not been included. Chassis setup, gear/tire combinations, and changes to driving technique (among other factors) all have a role in maximizing the parts combinations we're exploring. As when racers begin experimenting on their own with the parts and fuels we have been and will continue investigating, there's little doubt further improvements will surface.
The overriding objective of the project has been to identify and examine environmentally-friendly additions to the current motorsports landscape. It remains for the race-sanctioning bodies and segments within the racing participant sectors to decide if, when, or how they want to begin using what the project is validating. Best of all, no immediate end is in sight for this exercise.
Petroleum Displacement And Greenhouse Gas Reduction
While it may not be of major concern to racers right now, one final and extremely important factor to consider is the environmental impact provided by this project. Currently, nearly all race fuel comes from the same source that's used in our day to day transportation. This fuel source is pumped out of the ground from wells, processed, and shipped-either by truck or pipelines-to the local fueling stations. We then purchase the fuel, burn it in our car, and fill it back up when empty.
Summarizing earlier articles, the United States currently consumes approximately 20 million barrels of oil per day, 365 days a year, approximately 65 percent of which is imported. This rate is one quarter of the world's total consumption. To put this in perspective, if one were to take the number of 55-gallon drums of petroleum the U.S. consumes in a single day and place them side by side along Interstate 40, the line of drums would stretch from the West Coast all the way to the East Coast, back to the West Coast and then back east to Amarillo, Texas. Since this source is non-renewable and has a limit, there will come a time in which the transition to other energy sources must occur.
Petroleum displacement is defined as the amount of petroleum that can be substituted by another energy source. The total amount of petroleum used by transportation includes the amount used to produce and transport the fuel, known as "well-to-tank." The amount used to propel a vehicle (or race car) is called "tank-to-wheels." The sum of these is the "well-to-wheels" petroleum consumption number.
To reduce the petroleum used on a well-to-tank basis, its concentration in fuel can be reduced. For this project, E85 was the fuel chosen. By doing so, the team effectively replaced 85 percent of the petroleum-based fuel with a renewable fuel (ethanol). Note that in the processing of E85 some petroluem is consumed on the well-to-tank basis, therefore the reduction is not exactly a one-to-one relationship. Even so, in a 30-lap race with the car averaging 5 mpg, less than 1 gallon of petroleum would be consumed in an E85-fueled engine.
Another issue is global climate change. The largest contributor of greenhouse gases from transportation is carbon dioxide (CO2). The total amount of CO2 from vehicles is the sum of the CO2 generated in making the fuel, well-to-tank CO2 plus the amount generated from tank-to-wheel. This is defined as well-to-wheel CO2. Since petroleum is pumped out of the ground, processed and burned, there are no upstream factors reducing the total amount formed. However, if the fuel used comes from a renewable source that requires atmospheric CO2 to grow, the total well-to-wheel carbon footprint may be greatly reduced.
To fully evaluate energy emission impacts of advanced vehicle technologies and new transportation fuels, the fuel cycle from wells to wheels and the vehicle cycle through material recovery and vehicle disposal need to be considered. Sponsored by the U.S. Department of Energy's Office of Energy Efficiency and Renewable Energy (EERE), Argonne has developed a full life-cycle model called GREET (Greenhouse gases, Regulated Emissions, and Energy use in Transportation). It allows researchers and analysts to evaluate various vehicle and fuel combinations on a full fuel-cycle/vehicle-cycle basis.(www.transportation.anl.gov/modeling_simulation/GREET/)
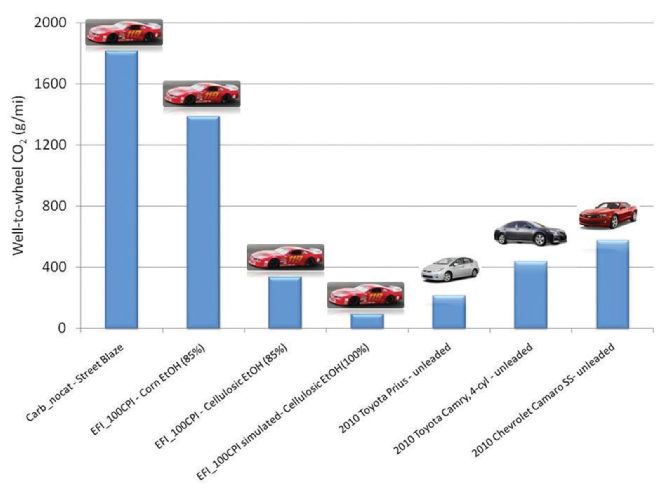
In the case of cellulosic E85, 85 percent of the fuel comes from natural biomass that absorbs atmospheric CO2, and grows through the process of photosynthesis. This greatly reduces the well-to-wheel carbon footprint. Using Argonne's GREET model along with data collected from the track, CT's team analyzed the total well-to-wheel carbon footprint of the Camaro, using both petroleum-based race fuel and cellulosic ethanol. For cellulosic ethanol, our analysis used switch grass as feedstock and included corn-based ethanol, race fuel, and modern production vehicles for comparison.
The results from this well-to-wheel analysis are startling. By switching to corn-based E85, a race team would lower greenhouse gas emissions by 25 percent. If it used a cellulosic blend of E85, the race car would have a lower greenhouse gas impact than an unleaded-fueled, '10 Toyota Camry. If it used a 100 percent blend of ethanol (E100), the car would have a lower greenhouse gas impact than an unleaded-fueled Toyota Prius! In fact, the race car would exhibit a greenhouse gas impact of a vehicle that ran on unleaded fuel, achieving 115 mpg. In addition, using E85, over a 30-lap race (including two warm-up laps), only one gallon of non-renewable fuel would have been consumed. Using E100, not a single drop of petroleum would be used. Domestically-generated money spent on fueling the vehicle would stay in the U.S., supporting local industry. That's a win for everyone involved.