The use of a dyno to measure horsepower and torque is a valuable tool for the racer. If you use the dyno just to see what kind of torque and horsepower numbers your engine is developing, that may be an interesting data point and a conversation starter but it really diminishes what you can learn from this tool. The measurement of the torque the engine produces and the calculation of horsepower is only one small part of the equation.
Once you have the information, developed the best power settings, and are confident that your time on the dyno has maximized a given combination it is now time to take the engine to the track and see what you can do with what you have learned. The new knowledge you have gathered will or should be driving changes to the car and possibly to even how you drive the car.
 Learning just how various engine settings can and will affect your engine's power development and the shape of the power curves. The many various systems on the engine all interact to contribute to the production of power.
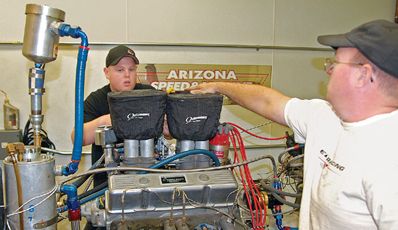
We were able to take part in a dyno test at RPM Engine Development in Chandler, Arizona. This particular engine was going to be raced in the Renegade Sprint Series and is a very heavily regulated 315.9 max cubic inch small-block Chevrolet. Series rules mandate a GM 305 block (you have a choice of 10 different casting numbers) with a spec 305 head, a max compression ratio of 10.25 to 1, flat tappet cam, and constant flow butterfly type fuel injection. Plus, all engines in the Renegade Sprint Car Series must be inspected and sealed prior to competing in any scheduled racing event.
The particular engine combination we are testing is designed more for durability, longevity, economics, and to keep the field even from a power perspective. It was not designed for all out power production. The intent of this dyno run was to develop a better understanding of the power produced and then make adjustments that were legal and within the scope of the rules. It is interesting to note that none of the seals that were in place on the engine were removed as part of the test, and engine legality was never violated.
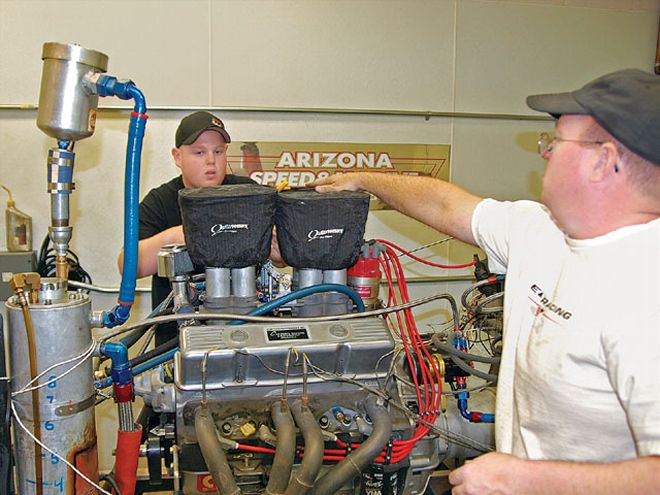
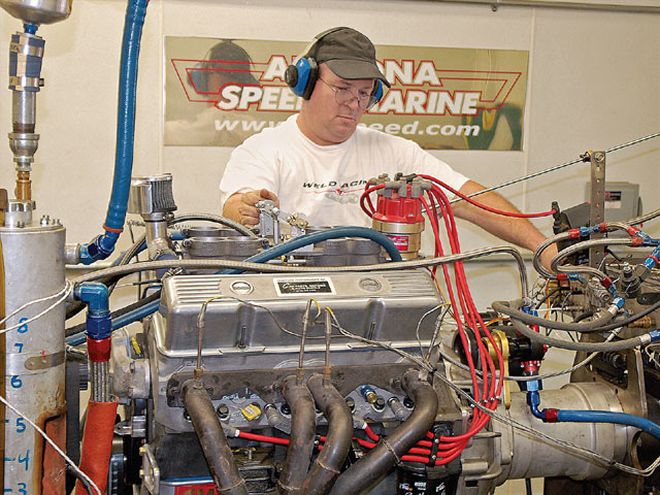 Engine builder Billy Smith is going through a final check prior to installing the inlet stacks and air filters. It was at this time all the linkage, fuel lines, and ignition were double checked prior to starting the dyno pulls.
Once you leave the dyno you should be armed with some documentation gleaned from the dyno runs. You need to be concerned not only with the peak power but where the torque and horsepower numbers are versus engine rpm. These critical bits of data are just what you paid for. Often times the data will be formatted in columns of numbers. While this is useful information, changing the presentation of the data into a series of graphs that illustrate the shape of the curve is sometimes a better way to display the data. It is the shape of the curve or curves that we are really concerned about. The shape of this curve will help you to better visualize the maximum usable engine power and the rpm where it occurs. It is far too simple to just look for the big numbers and miss what the data is really saying. The key is the shape of the curve and the range of usable power.
Just a small caution about data presentation and the potential for statistical gamesmanship as it pertains to data analysis. There are many ways to present data, what needs to be remembered is the data is what it is and no more. Please avoid the temptation to make what you have more than it really is. The quest for speed and power is not about the big number that you can get by playing with, shaping, smoothing, or massaging the data to try and see something that is just not there. It is all about taking what you can learn about the test session you just completed and understanding the power and how you can best use the information, nothing more. Do not let yourself be seduced by the quest for the "big" number. Avoid the dark side.
Prior to putting this information to use, let's talk about the dyno runs.
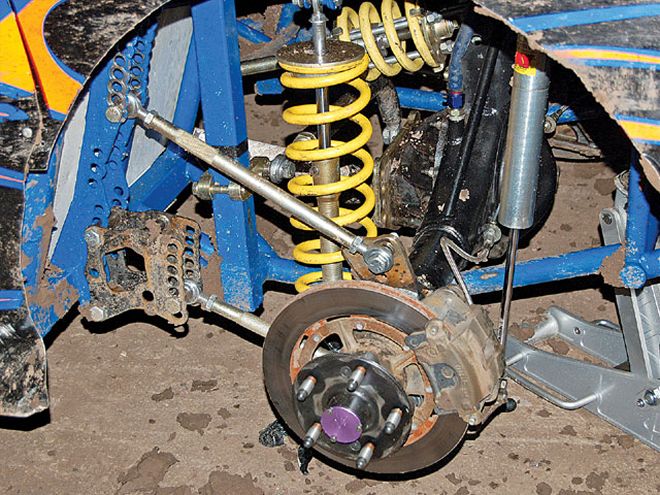 Once you fully understand the power of your engine you may have to delve deeper into the chassis settings to make sure you are matching the torque development of the engine to the torque application to the track. The chassis is a critical part of getting all the power your engine is developing to the track.
* What was your goal from the test, aside from seeing just what the engine would develop from a power perspective?
* What were you trying to learn?
* Were you trying out different engine components?
* Were you looking at various adjustments and how they would effect the power output?
* Were you just working to better understand the power characteristics of your engine?
We need to keep in mind that tuning is a process, a process with multiple variables and what would seem to be an infinite number of different combinations. The process of tuning is that of matching given components and adjustments to yield the best possible performance from the sum of all the components and or adjustments that you have to deal with. If we were to assign an algebraic equation to this process if would be Y= (f)X. English translation, Y is equal to a function of X. "Y" would be equal to the output of the process, or in this case the performance of the car on the track. "X" would be equal to all of the various components and their respective adjustment settings (i.e. engine, chassis, gear selection, etc.). Quite simply, X is the product of every adjustment and component on the car. Remember the engine is just one of the variables in this equation. Contrary to popular opinion the engine is not the center of the universe on a racecar.
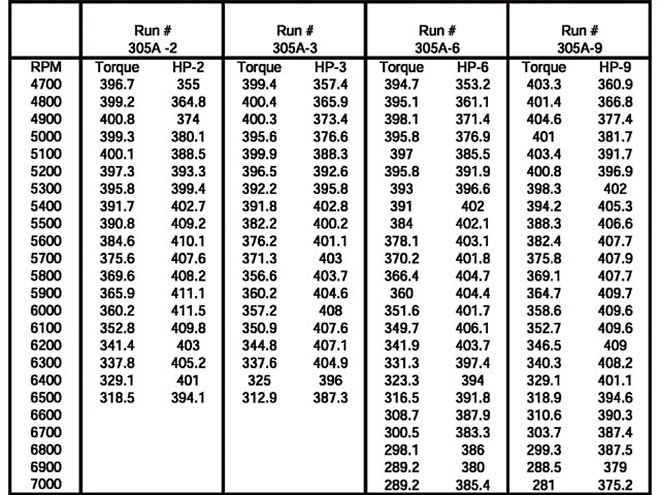 With the data in this format it is a bit more difficult to really see what is going on. Most people will scan the columns and look for the biggest numbers. (Come on, you were looking for the big numbers weren't you?) But taking the same data and placing it into a graph we can get a better idea of what is going on with the power production.
Sounds simple enough-just plug all of the various parameters into the setup and go out and start racing. While this is easy to say, or in this case write, the proof is in the pudding-so given the idea that the performance of the car is tied to a variety of different factors. Why do we place so much emphasis on the performance of the engine? The simple answer is that the engine provides all of the power required to move the car. It is our ability to adjust the engine to a given condition or conditions that will be a significant part of the winning equation.
This is not to say that the chassis provides a minimal contribution. In reality the contribution of the chassis is probably more significant than the engine, but you have to have all the components working together to build a winning car. You can place a very strong engine in a poor handling car and you still have a poor handling car. But place a good engine in a chassis tuned to accept the power the engine is making you will have a race winning combination. The power characteristics of the engine will help to govern the way we adjust the car. We use the dyno to quantify the power characteristics of the engine. The adjustments we make to the engine and the components we use as part of the engine package determine the power of the engine. There are a great number of factors that have a great deal of interactions and as tuners we have to integrate the whole package.
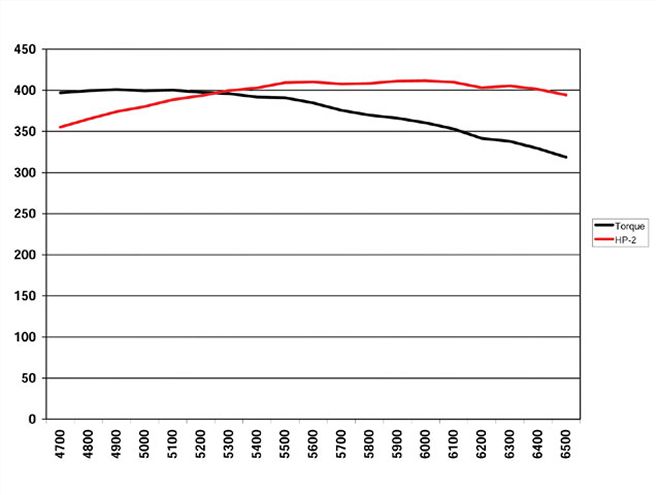 Graph A - Taking the data and placing it into a graph we can get a bit better picture of just what is happening with both the torque and the horsepower. The torque peaks at about 5,200 rpm and the horsepower peaks 6,100-6,200 rpm on this run.
Let's spend a bit of time talking about rpm. We all have seen the in car telemetry from the tier one series on TV and the announcers seem to get pretty excited when the RPM levels start to exceed 9,200 in Cup cars while Formula 1 cars can rev well past 19,000 rpm! For the Saturday night racer it is very rare to see engines running over the 8,500 rpm level, and even that is more of the exception than the norm. For the most part the Saturday night racer will have engines that operate from 6,000 to 7,500 rpm. In the classes that are heavily restricted, the rpm levels will be biased to the lower part of that range. Just because an engine will rev to a particular level does not mean that you need to spin it that fast. There will be points where you will be able to rev past the usable part of the power band. Remember that more rpm is not always a good thing.
With the data in the form of a graph, we can see the shape of the horsepower and torque curves. Remember we are not trying to see the big number but we really are looking at the areas underneath the curves. The analysis of the data is going to focus on understanding what the engine is doing from a power perspective. In order to better see just what is happening we need to look a bit closer. In the original graph (Graph A) the horsepower and torque ranged from 0 to 450. If we change the horsepower range from 300 to 420 (Graph B) we will expand the definition of the curve and get a clearer picture of the power characteristics.
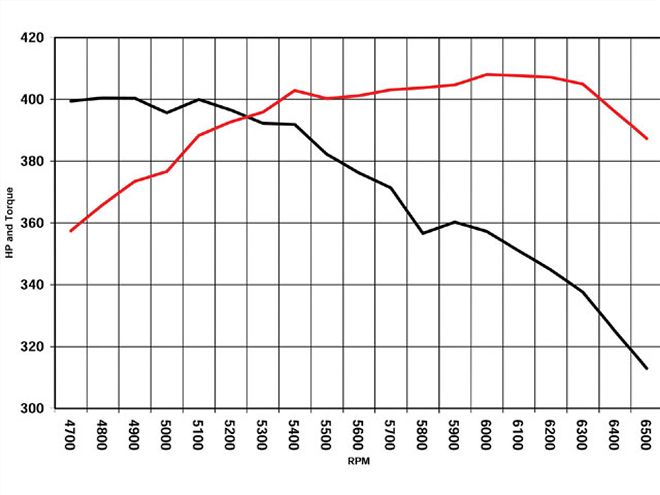 Graph B - If we change the scaling and add some grid lines the graph gets even easier to read and the shape of the curve is much more telling. The torque peak is happening at the same place and the horsepower is falling off at the same rpm but now you get a much clearer picture of what is really happening. We did not change the data but we put the data in a much more usable form. By changing the scaling we eliminate the parts of the graph we do not need to see. There was no information below 300 hp or 300 foot-pounds of torque. So why not make the graph reflect that and tell a much clearer story.
The initial runs on the dyno yielded that the engine was producing a very flat power curve from 4,000 rpm to 6,500 rpm. It was also noted that the power was falling off very quickly as the rpm climbed past 6,500. But before we claim a victory we need to look at more data. We made several adjustments to the engine on the dyno trying to maximize the power. Nothing that would make the engine illegal, but we have some room to adjust and change timing, jetting, valve lash, and work with other engine parameters. If we take the horsepower curves from several of the different tests we can see that some of the adjustments affected the power curves in different ways. Once again we will adjust the scaling on the graph and place all the runs into the graph so it becomes even easier to see any differences no matter how small or large.
When viewing all of the power curves arranged in the same graph (Graph C) we could clearly see differences in the shapes of the curves. Remember we are looking at a very small difference in peak power between all the runs. The delta between all the runs was less than 10 hp but the width of the power band or the area under the curves did exhibit some fairly significant differences up to 6 percent.
* HP-2 showed a unique bimodal peak with a hole or a dip in the power from 5,600-5,850 rpm. This run also had the highest peak power over about a 300 rpm range but it also showed a very steep fall off post peak.
* HP-3 showed a reduction in total power and also exhibited the same dip in the power curve over the widest range of the power curve. Although the dip was not as severe it was exhibited over a wider portion of the power curve.
* HP-6 also showed a reduction in power with some significant perturbations at the peak(s) and a nearly sign off at the end of the curve.
* HP-9 curve was very good. The power started earlier in the rpm range and was stronger over a wider rpm range than all of the other curves illustrated. The peak in power was not as strong as HP-2 but it was more stable as the rpm level reached the peak. Early in the lower rpm levels this run showed one to three more horsepower from the lowest rpm to 5,500 rpm and there were no dips from 5,500 to 5,900 rpm.
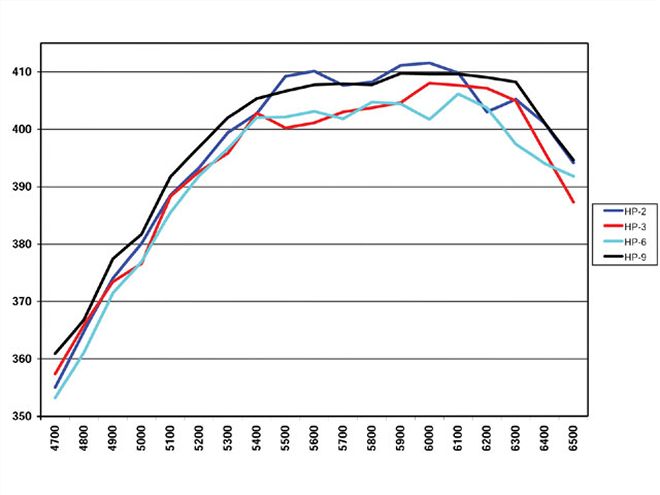 Graph C - With the data formatted in this way we can see each power curve and get a better idea of how they compare. It is clear that the engine makes a fairly similar power curve even after some adjustments but there are differences in the peak power, where the peak occurs and the general shape of the curve.
As you perform any power curve analysis you have to keep several things in mind and answer some questions that will effect how you set up and adjust the car.
* What rpm ranges will the car go through on the track?
* Is the current gearing allowing the engine to over rev?
* Is the current gearing too tall and not allowing the engine to rpm in the correct range?
* What will be your lowest rpm and what will the highest rpm be on the track?
* How will the power characteristics of the engine affect how you drive the car?
* How will the power characteristics of the engine affect your chassis setup?
* Shocks
* Springs or torsion bars
* Sway bars
* Is the engine power shocking the setup? (i.e., is the power too violent for the current suspension setup?)Does the driver skill and the power curve match? (This is a very important question to answer, be honest! This is often a difference between a rookie and a seasoned driver.)
* How would you adjust the suspension if the car suddenly had50 more horsepower?
* How would you adjust the car if you suddenly had less power?
Looking at the data and having some conversations with the driver it was discovered that in the car the engine was being spun to over 7,200 rpm at the end of the straight. At that rpm the engine was way past the horsepower peak. Clearly the car was not going to be accelerating as strongly as it was at 6,300 rpm. We need to remember that the faster the car goes the more power is required to just maintain the speed the car has attained to that point. And, the power requirement is not linear it is exponential. The acceleration rate is determined by how much extra power is needed just to maintain the forward motion at the current rate.
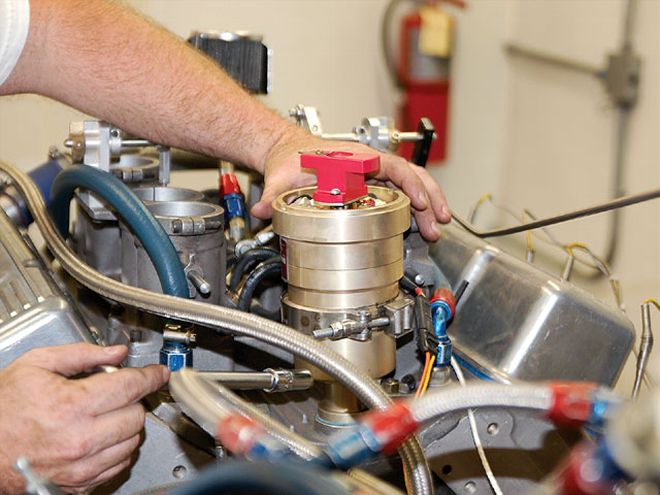
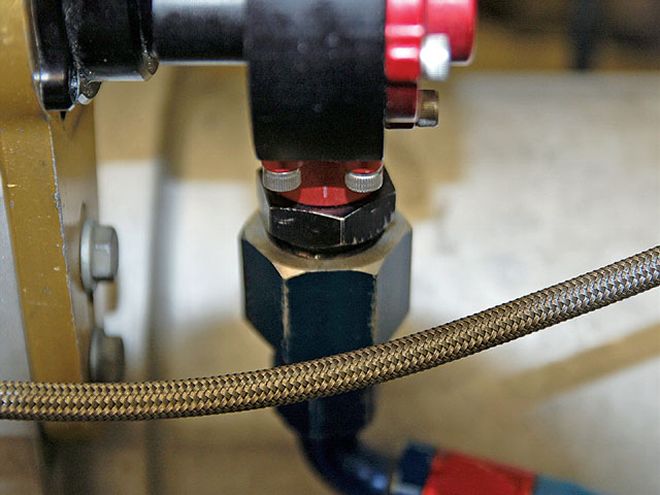 We were able to see a fitting that had cracked and was leaking fuel at high pressure. This could have been a disaster had a fire started on the racecar while in the track. This is something that would have been very difficult to see while the car was running on the track until it was too late.
On this particular car they run a wing and while wings do provide downforce they also require a good deal of power to push through the air, because of the drag. Clearly spinning the engine past its power peak would result in a less than desirable condition. Not to mention that as the level of rpm is elevated the loads on the engines components rise significantly. Granted some level of over rev may be required due to how tight the corners may be at a given track, but the data says that a gear change may be in order.
This engine does not have an abundance of power when compared to a 360 or an open 410 Sprint engine and how the car is being driven may be a consideration. The act of backing a Sprint Car into the corner may look cool and be flashy but that kind of driving takes some real power to accomplish. It may make sense to try to adjust the setup on the car to a less aggressive style. The driver may need to blue groove the car or keep the car as straight as possible to avoid scrubbing off to much speed.
Placing an engine on the dyno also allows you to see the engine in operation from a unique perspective that we can't observe while it is in the car in a racing environment. In this particular engine test we were able to see a fuel leak that we wouldn't have been able to detect with the engine installed in the car. There was a cracked fitting in the fuel system that was leaking at high engine speed and at the highest fuel pressure levels. Aside from the tuning issues this type of leak can cause, there was the added component of potential fire hazards created from this leak.
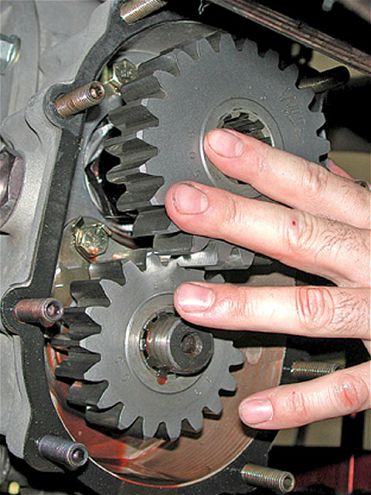 Once you fully understand the power curves you may need to make some adjustments to the gearing. This is a simple process on a car equipped with a quick-change rearend. If you are racing a Modified or Stock Car, or any other car that uses a rearend with its roots in passenger cars, you may have to change the ring and pinion to change the final gearing.
Clearly, once you dyno your engine and develop a data package you are going to have to ask a good deal of questions as to how you can best use this information. I have yet to run into a racer who wants less power. The issue is that no matter if you are a hobby racer or a professional, you are racing. Understanding the type and level of power your engine is developing is very valuable and critical information. This data set can make many tuning decisions much easier. Especially those questions centered on how the final gearing will be set. The gear in the car not only will affect the rpm of the engine, it also will determine how the torque the engine makes is applied to the track. How the car is geared is often a very under utilized tuning tool.
Conversations with your engine builder will let you know just what level of power you should expect from a given package so you will know if you are close or way off base to what a given engine package will develop. If you are in the ball park great, if you are low you may need to do some more work and try to understand just why your particular package is not making the power levels it should. There are some simple rules to follow during your analysis and implementation.
* Don't spin the engine any faster than you really need. If it stops making power at 6,300 rpm there is no good reason to spin it much past the peak. You will just be decreasing the life of the engine and risking expensive internal damage.
* Do not try to read more into the data than is really there.
* You do not need computers and fancy statistical software to make good graphs. Just some graph paper, a ruler, and maybe some colored pencils are all you really need. Scale the graphs to make the data as clear as possible, 500 rpm increments are usually more than adequate.
* Refer to the data often.
* Don't be afraid to ask questions and employ some critical thinking.
This is not as complex as some would have you believe. There are many great engine shops all across the country that will be glad to help you through this process without having to get a second mortgage on your house. Get the data and spend time looking over the results. If you have questions ask the engine shop or the dyno shop that did the work. They have a vested interest in your success.